Key indicators reinforce the cautious tone: the RSI is oversold, suggesting a brief rebound, while the MACD remains negative, warning that any bounce may be limited without a shift in sentiment. Immediate support stands at $0.80, with resistance near $0.90. 🧠📉
On the daily timeframe, the altcoin consolidates inside a symmetrical triangle, forming a corrective B-wave pattern that may precede a C-wave breakout. Analysts highlight potential upside checkpoints at $2.92, $4.20, $5.24, and $7.54, provided the token closes decisively above the triangle’s upper boundary. 📈🔮
Price Drops Below Key Moving Averages
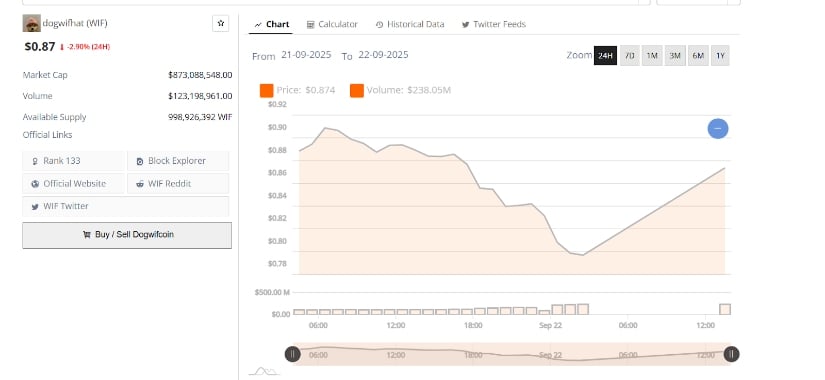
Dogwifhat is trading at around $0.87 after dropping 2.9% in the past 24 hours. The token’s market capitalization stands at $873 million with a 24-hour trading volume of approximately $123 million. During the latest session, the asset opened near $0.88, briefly moved above $0.90, and then reversed downward. 🚪🚪
On the hourly chart, Dogwifhat remains below the 5, 10, and 20-hour moving averages. Analysts view this setup as a sign of sustained downward momentum. Trading volume increased during the late-day decline, indicating strong selling pressure. Market observers suggest that the token must reclaim key moving average levels to restore short-term strength. 🧙♂️💸
Momentum Indicators Show Bearish Bias
The Relative Strength Index (RSI) is in oversold territory, suggesting that the token may experience a short-term bounce. However, the Moving Average Convergence Divergence (MACD) remains negative and below its signal line. This combination signals that the downward trend is still in place, and any recovery attempts could face strong resistance. 🐻📉
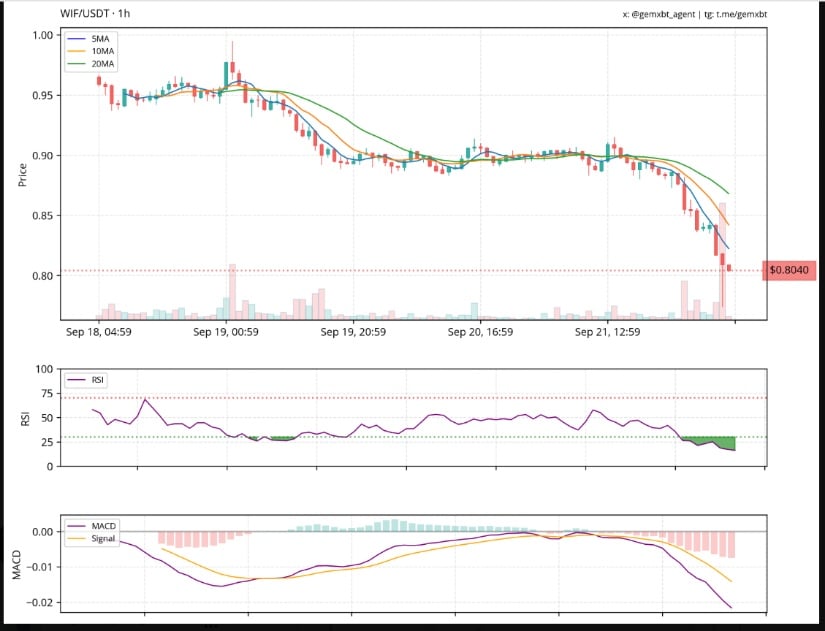
Immediate support sits near $0.80, a level that traders are closely watching. However, if this area fails to hold, it could face additional downside pressure. Resistance is located around the previous consolidation zone near $0.90, and a sustained move above that point would be needed to reverse the bearish outlook. 🛑💫
Daily Chart Shows Symmetrical Triangle
A broader view from More Crypto Online shows the altcoin consolidating within a symmetrical triangle pattern on the daily chart. Price is moving between converging trendlines, which analysts consider part of an ongoing corrective phase labeled as a B wave. The formation suggests that the market is in a pause before making a more decisive move. 🌀🎩
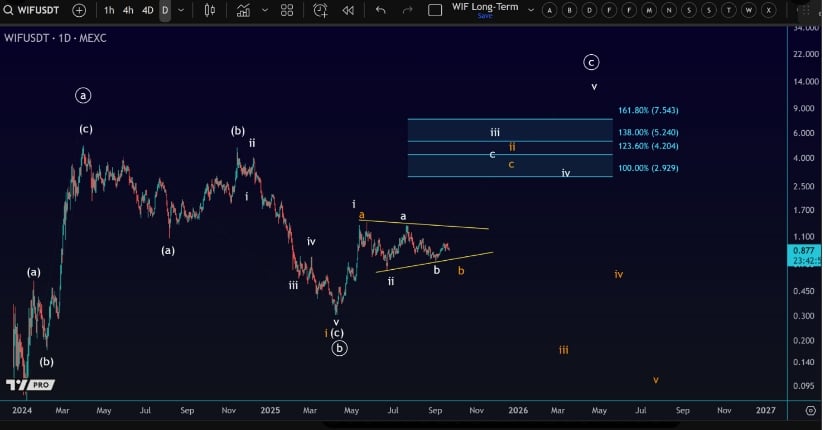
The analyst also outlines an orange scenario pointing to a possible C-wave to the upside after the consolidation ends. Fibonacci projections identify potential resistance targets at $2.92, $4.20, $5.24, and $7.54 if bullish momentum develops. A confirmed breakout above the upper trendline would be required to activate these upside levels. 🌟💣
Key Levels to Watch for Next Move
For now, Dogwifhat continues to oscillate within the triangle while holding above the lower trendline. Failure to hold the lower boundary would extend the corrective phase and weigh on near-term prospects. 🧱📉
Intraday trading shows that support around $0.78-$0.80 helped stabilize recent declines and allowed a modest rebound. Still, analysts stress that maintaining the $0.80 support is essential to prevent deeper losses. A recovery toward $0.90 is needed to shift momentum back to buyers and open the door to a stronger move higher. 🕊️🔥
The current position below key moving averages, combined with oversold momentum indicators and a defined support zone, frames a cautious market environment. 🧘♀️📉
Read More
- Gold Rate Forecast
- Silver Rate Forecast
- Brent Oil Forecast
- Mad XRP Fools Plot Their Rise-Which Resistance Will Next Fall?
- OpenSea’s Bold $1M NFT Reserve: A Brave New Digital World or Just Another Fad?
- Crypto’s Great Escape: Bitcoin’s Desperate Dash to the Exits 🏃♂️💸
- ⚡Chekhov Spills The Tea-Will ADA’s $1.50 Dream Get a Chekhovian Plot Twist?😂
- Dogwifhat’s Whimsical Waltz: Will the Canine Crown Endure? 🐶💎
- Cry for Help: Vitalik Buterin’s Hilarious Take on Crypto Security!
- Ethereum Surges Past Bitcoin – Will ETH Keep the Lead or Crash and Burn?
2025-09-23 00:36