Ah, Bitcoin, the trillion-dollar diva, still flexing its magnificent muscles in the morning light! Trading at a meaty $113,083 with a market cap that could make a country blush-$2.25 trillion-and a 24-hour trading volume that somehow manages to rival the GDP of small nations at $61.95 billion. Over the last 24 hours, the price ping-ponged between $112,009 and $114,762 like an over-caffeinated squirrel on a sugar high. It’s the kind of market that could either keep you awake for days or send you spiraling into existential dread.
Bitcoin
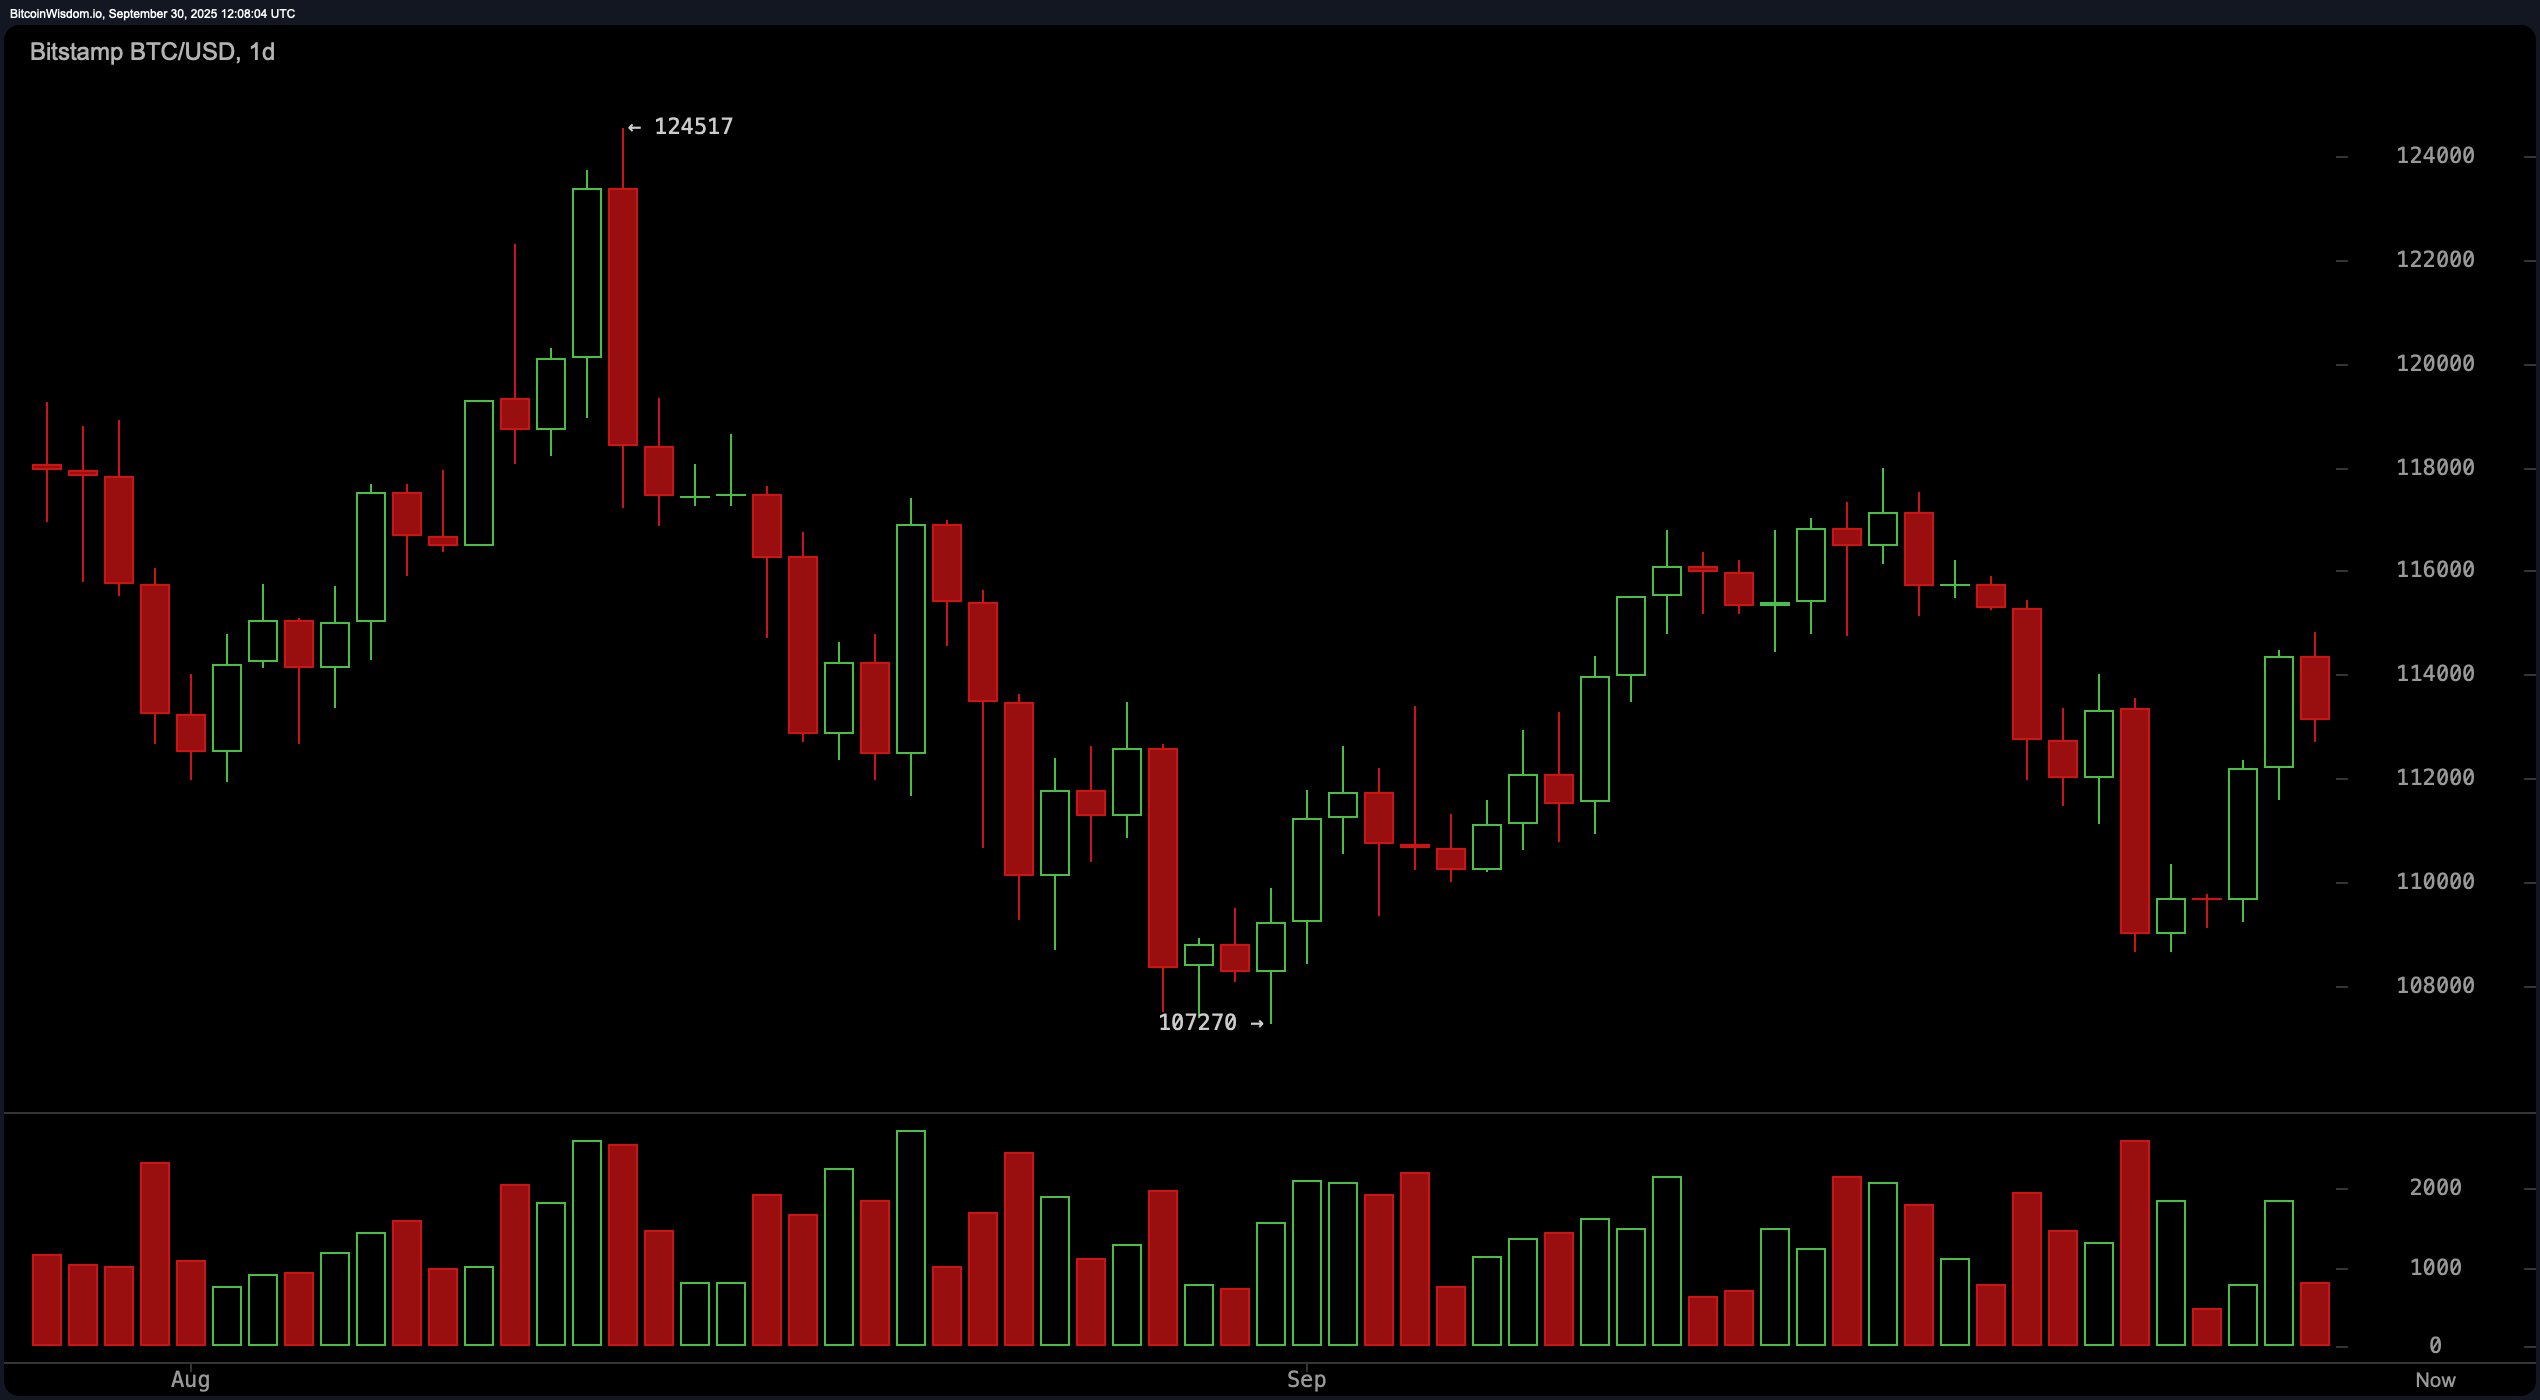
On the daily chart, Bitcoin is strutting along a high-wire after plummeting from its lofty $124,517 peak down to a mere $107,270. A dramatic plunge-like a soufflé collapsing under the weight of reality. Yet, like a true show-off, it’s back at it, floating above $114,000 as if the whole ordeal never happened, clinging to the $108,000-$110,000 support zone with the tenacity of a cat refusing to leave its favorite sunbeam.
The resistance, oh, the resistance, looms like an ominous cloud at $118,000-$120,000, waiting to spoil the fun if the bulls get too cocky. For those with ice in their veins (and maybe a dash of insanity), a potential entry in the $111,000-$112,000 dip zone might just be the golden ticket, with exits near that sweet, psychological $120K barrier. But be warned: don’t get lazy, or you’ll be left in the dust.
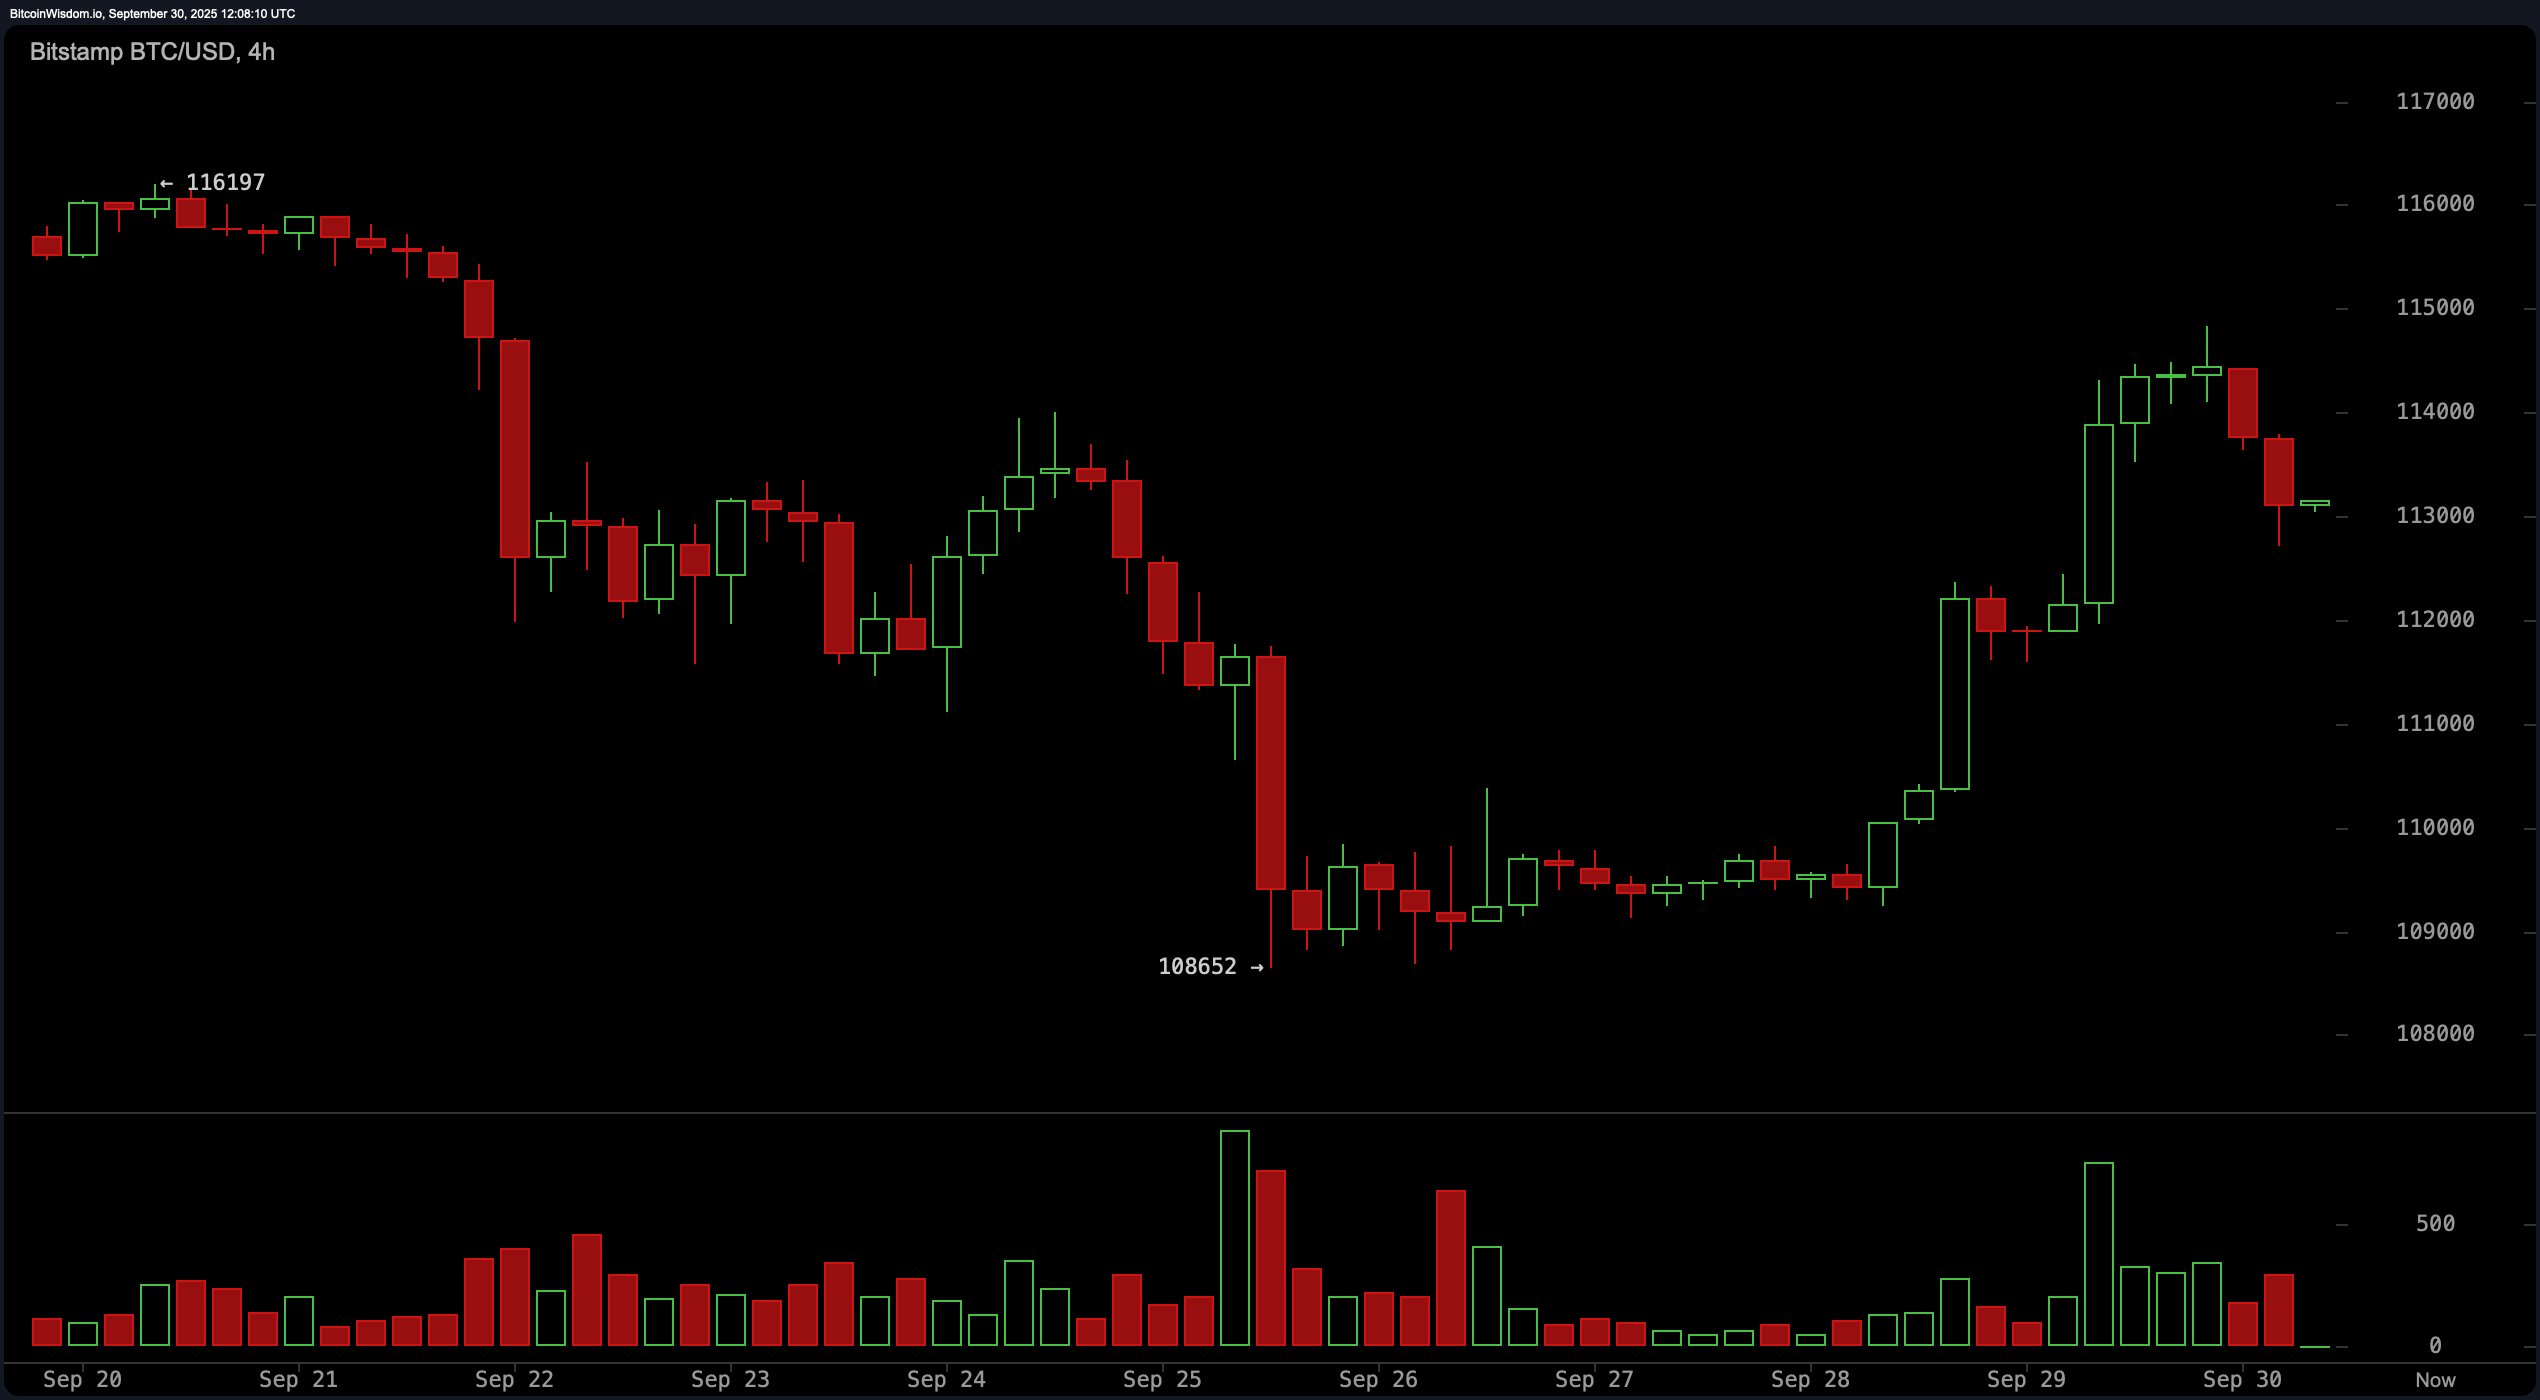
On the 4-hour chart, Bitcoin rebounded from $108,652 to a solid $115,000. Then it got stuck in the $113,000 neighborhood like a tourist who missed the last bus. Volume spiked during the recovery, a clear signal that the buyers haven’t ghosted yet, but those candles? They’re shrinking. More of a whisper than a shout. A tactical long entry in the $112,000-$113,000 zone might look like a juicy snack for scalpers eyeing a $115,500-$116,000 exit. But a dip below $111,000? It could spell trouble faster than you can say “double top.”
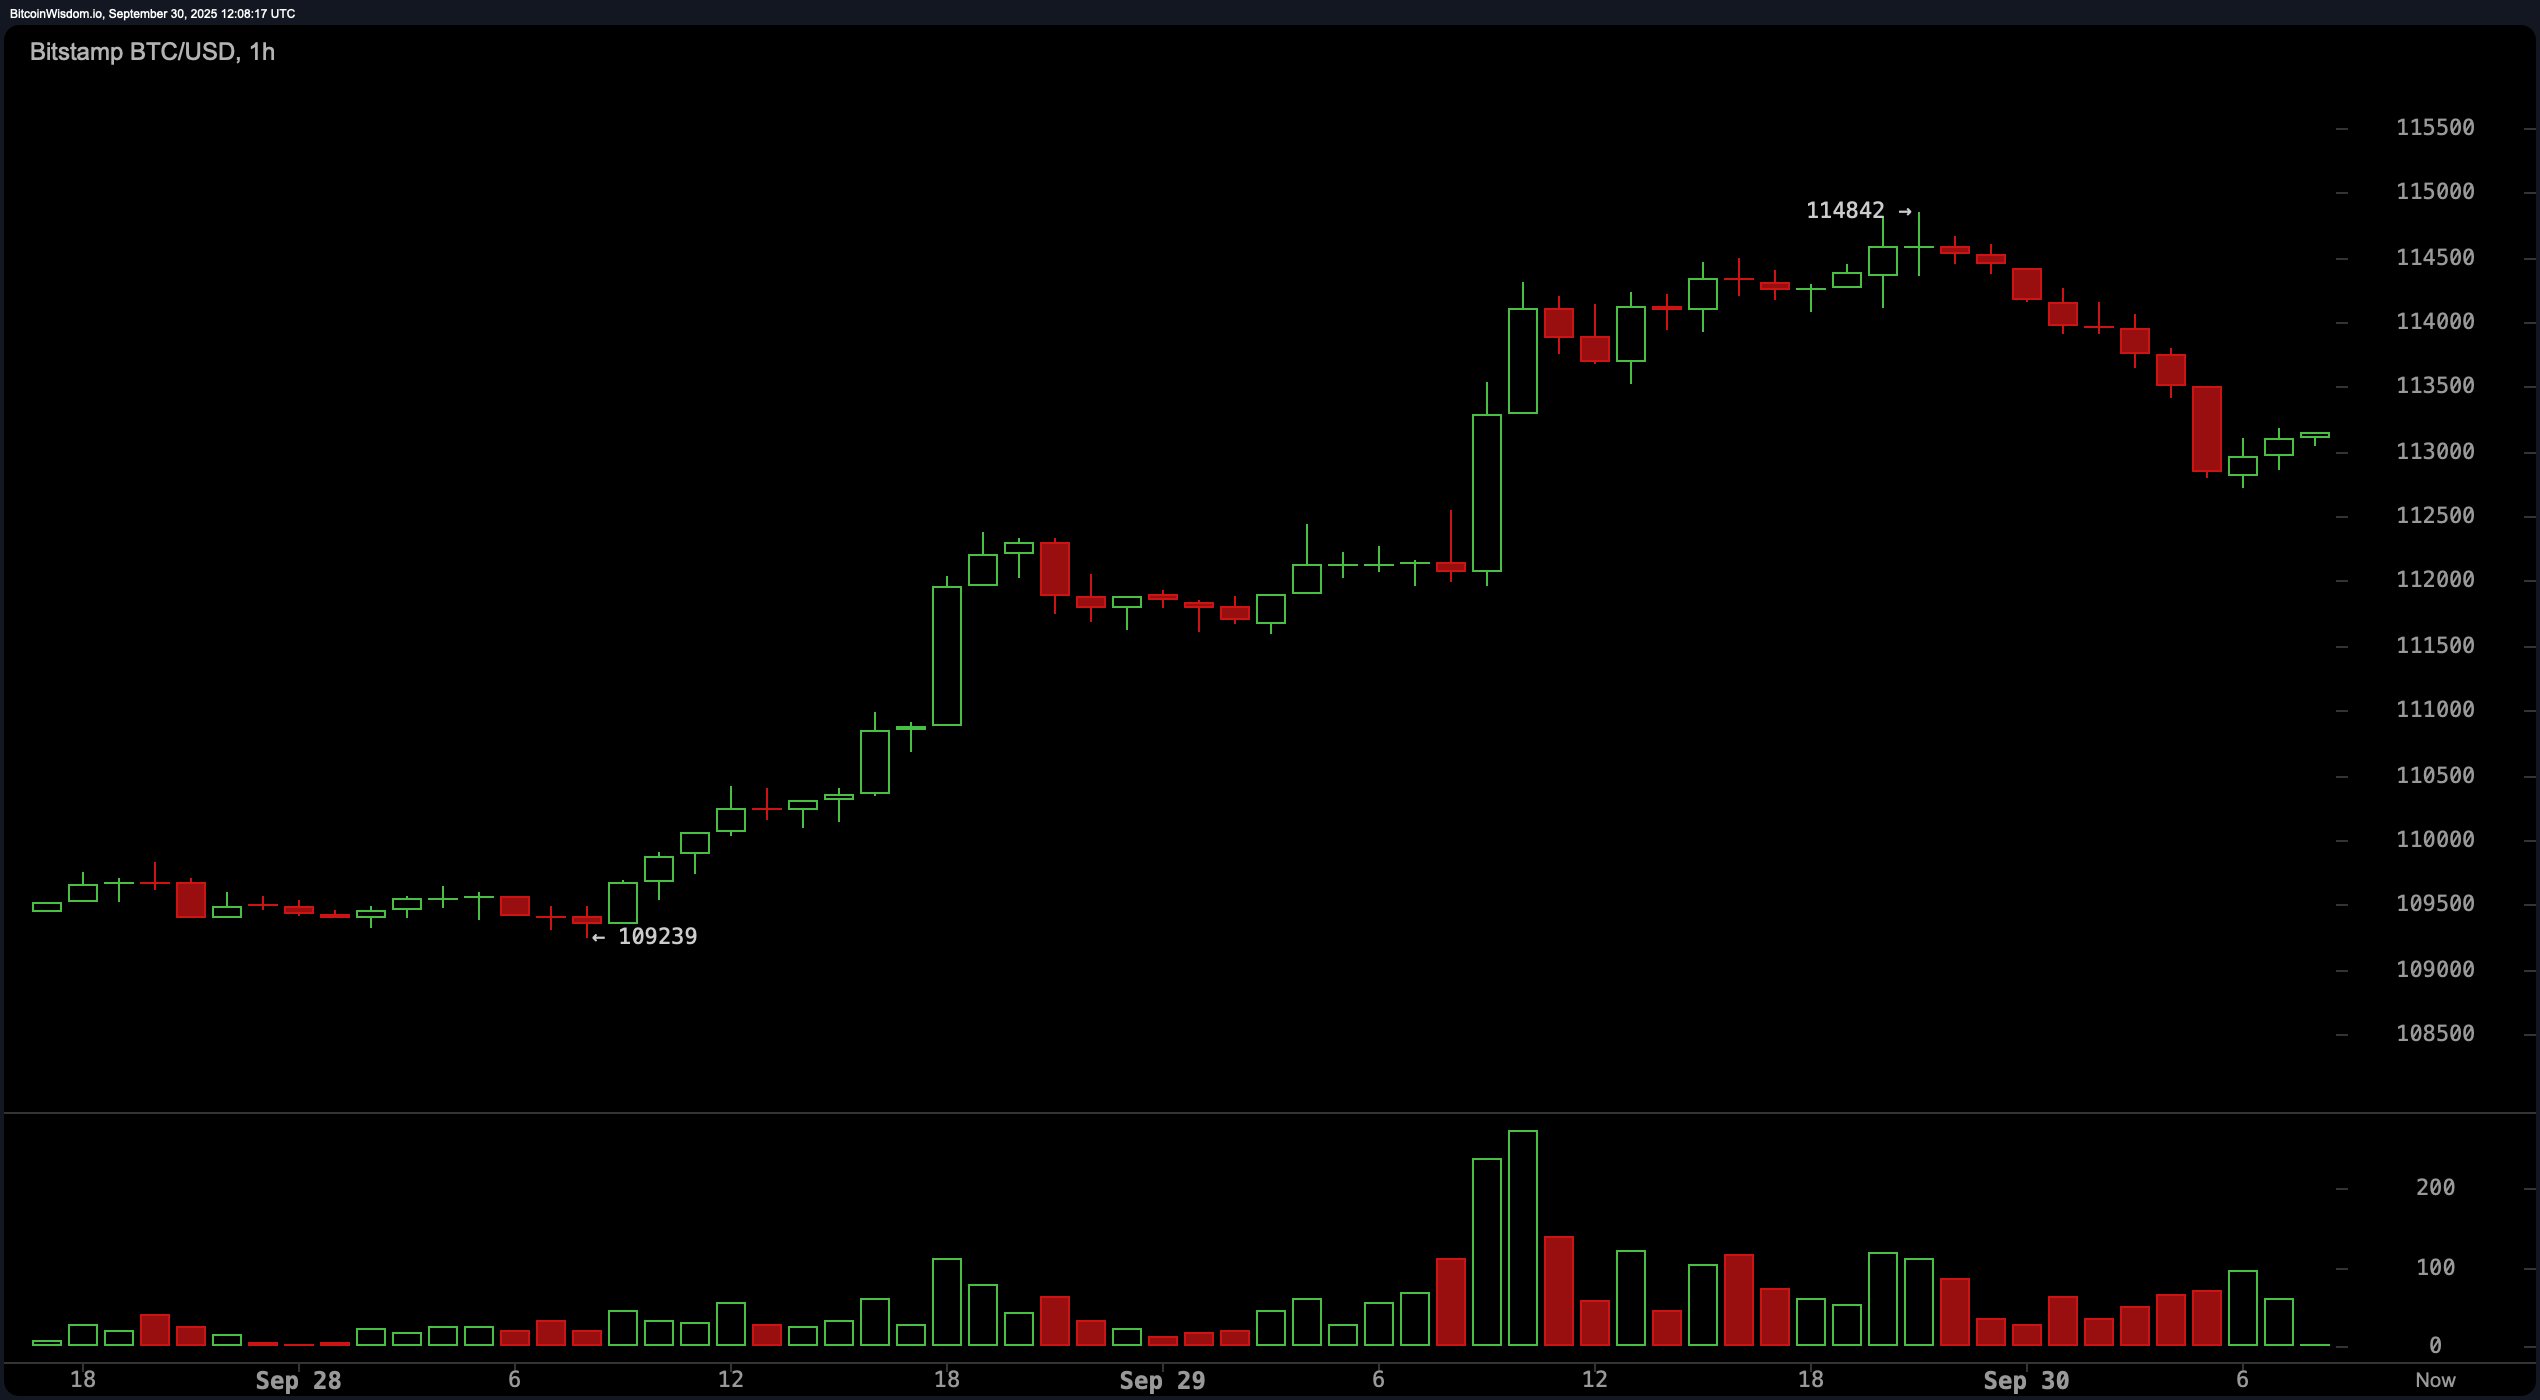
Now, zooming in on the 1-hour chart, Bitcoin took a little nap at $109,239, before getting its groove back at $114,842. Now it’s chilling around $113,000, looking neither panicked nor particularly motivated-like a teenager half-heartedly finishing a school project. Entries between $112,800 and $113,200 are still viable for the scalpers in the crowd, aiming at a neat $114,500-$115,000, but a drop below $112,500 could send this crypto rollercoaster careening straight for $111,000.
Now, let’s talk oscillators-because who doesn’t love a good oscillator to spice things up? These indicators are throwing more shade than a crypto Twitter feud, all screaming “neutral” like a jury unsure whether to convict or acquit. But the momentum and the MACD? They’re not mincing words. They’re flashing bearish signals, like a warning sign at a malfunctioning carnival ride. Momentum’s dragging at -2,643 and the MACD’s lagging at -419. These might just mean the bulls are winded… or they’re gearing up for another sprint.
And the moving averages? Oh, it’s a disaster in the kitchen. The 10-day EMA and SMA are cozying up to each other like two optimistic souls, while the 20-day to 100-day crew is as divided as a DAO vote gone wrong. The 20-day EMA is all bullish, while the 20-day SMA is throwing shade. The 30-day and 50-day averages are all “nope,” signaling a bearish trend. But, wait! The 100-day EMA and both 200-day averages are leaning bullish-meaning long-term holders might still have the upper hand… unless, of course, short-term volatility decides to play the villain.
Bottom line: as long as Bitcoin stays above $111,000, the bulls have their claws firmly dug in, with targets set for the $115,000-$118,000 range. But if that critical $111,000 level falls with any real conviction, brace yourselves-because this sell-off could head straight to $108,000. This market? Definitely not for the faint of heart, but it’s certainly the most entertaining thing on the internet.
Bull Verdict:
If Bitcoin stays above $111,000 and buyers keep trickling in, we might see a slow grind toward $118,000. The momentum’s a bit sluggish, but as long as support holds, the bulls have every reason to keep swinging. Cautiously optimistic, but still in the fight.
Bear Verdict:
Should Bitcoin tumble below $111,000 with volume backing it up, the stage is set for a deeper correction toward $108,000. With momentum indicators and moving averages flashing all sorts of bearish signals, the bears may soon grab the mic. This rally? It could just be a well-dressed pause before the next leg down.
Read More
- Trump’s Crypto Bailout: WLFI’s Points Scheme Takes the Stage
- Gold Rate Forecast
- XRP: The “Security” That’s Not? Bill Morgan Roasts the SEC!
- Silver Rate Forecast
- EUR USD PREDICTION
- USD THB PREDICTION
- EUR BRL PREDICTION
- XMR PREDICTION. XMR cryptocurrency
- Ethereum’s Supply Meltdown: Exchanges Dying for ETH Bucks! 🚀😏
- MNT PREDICTION. MNT cryptocurrency
2025-09-30 15:58