Bitcoin’s current flirtation below the $110,000 line is less a romance and more a transactional negotiation, as if the market itself were a dithering suitor at a county fair. With price action wobbling like a drunk on a tightrope and oscillators singing a tune of apathy, the market is playing coy-but make no mistake, a decisive move is imminent, though it may be more of a stumble than a stride.
Bitcoin Chart Outlook
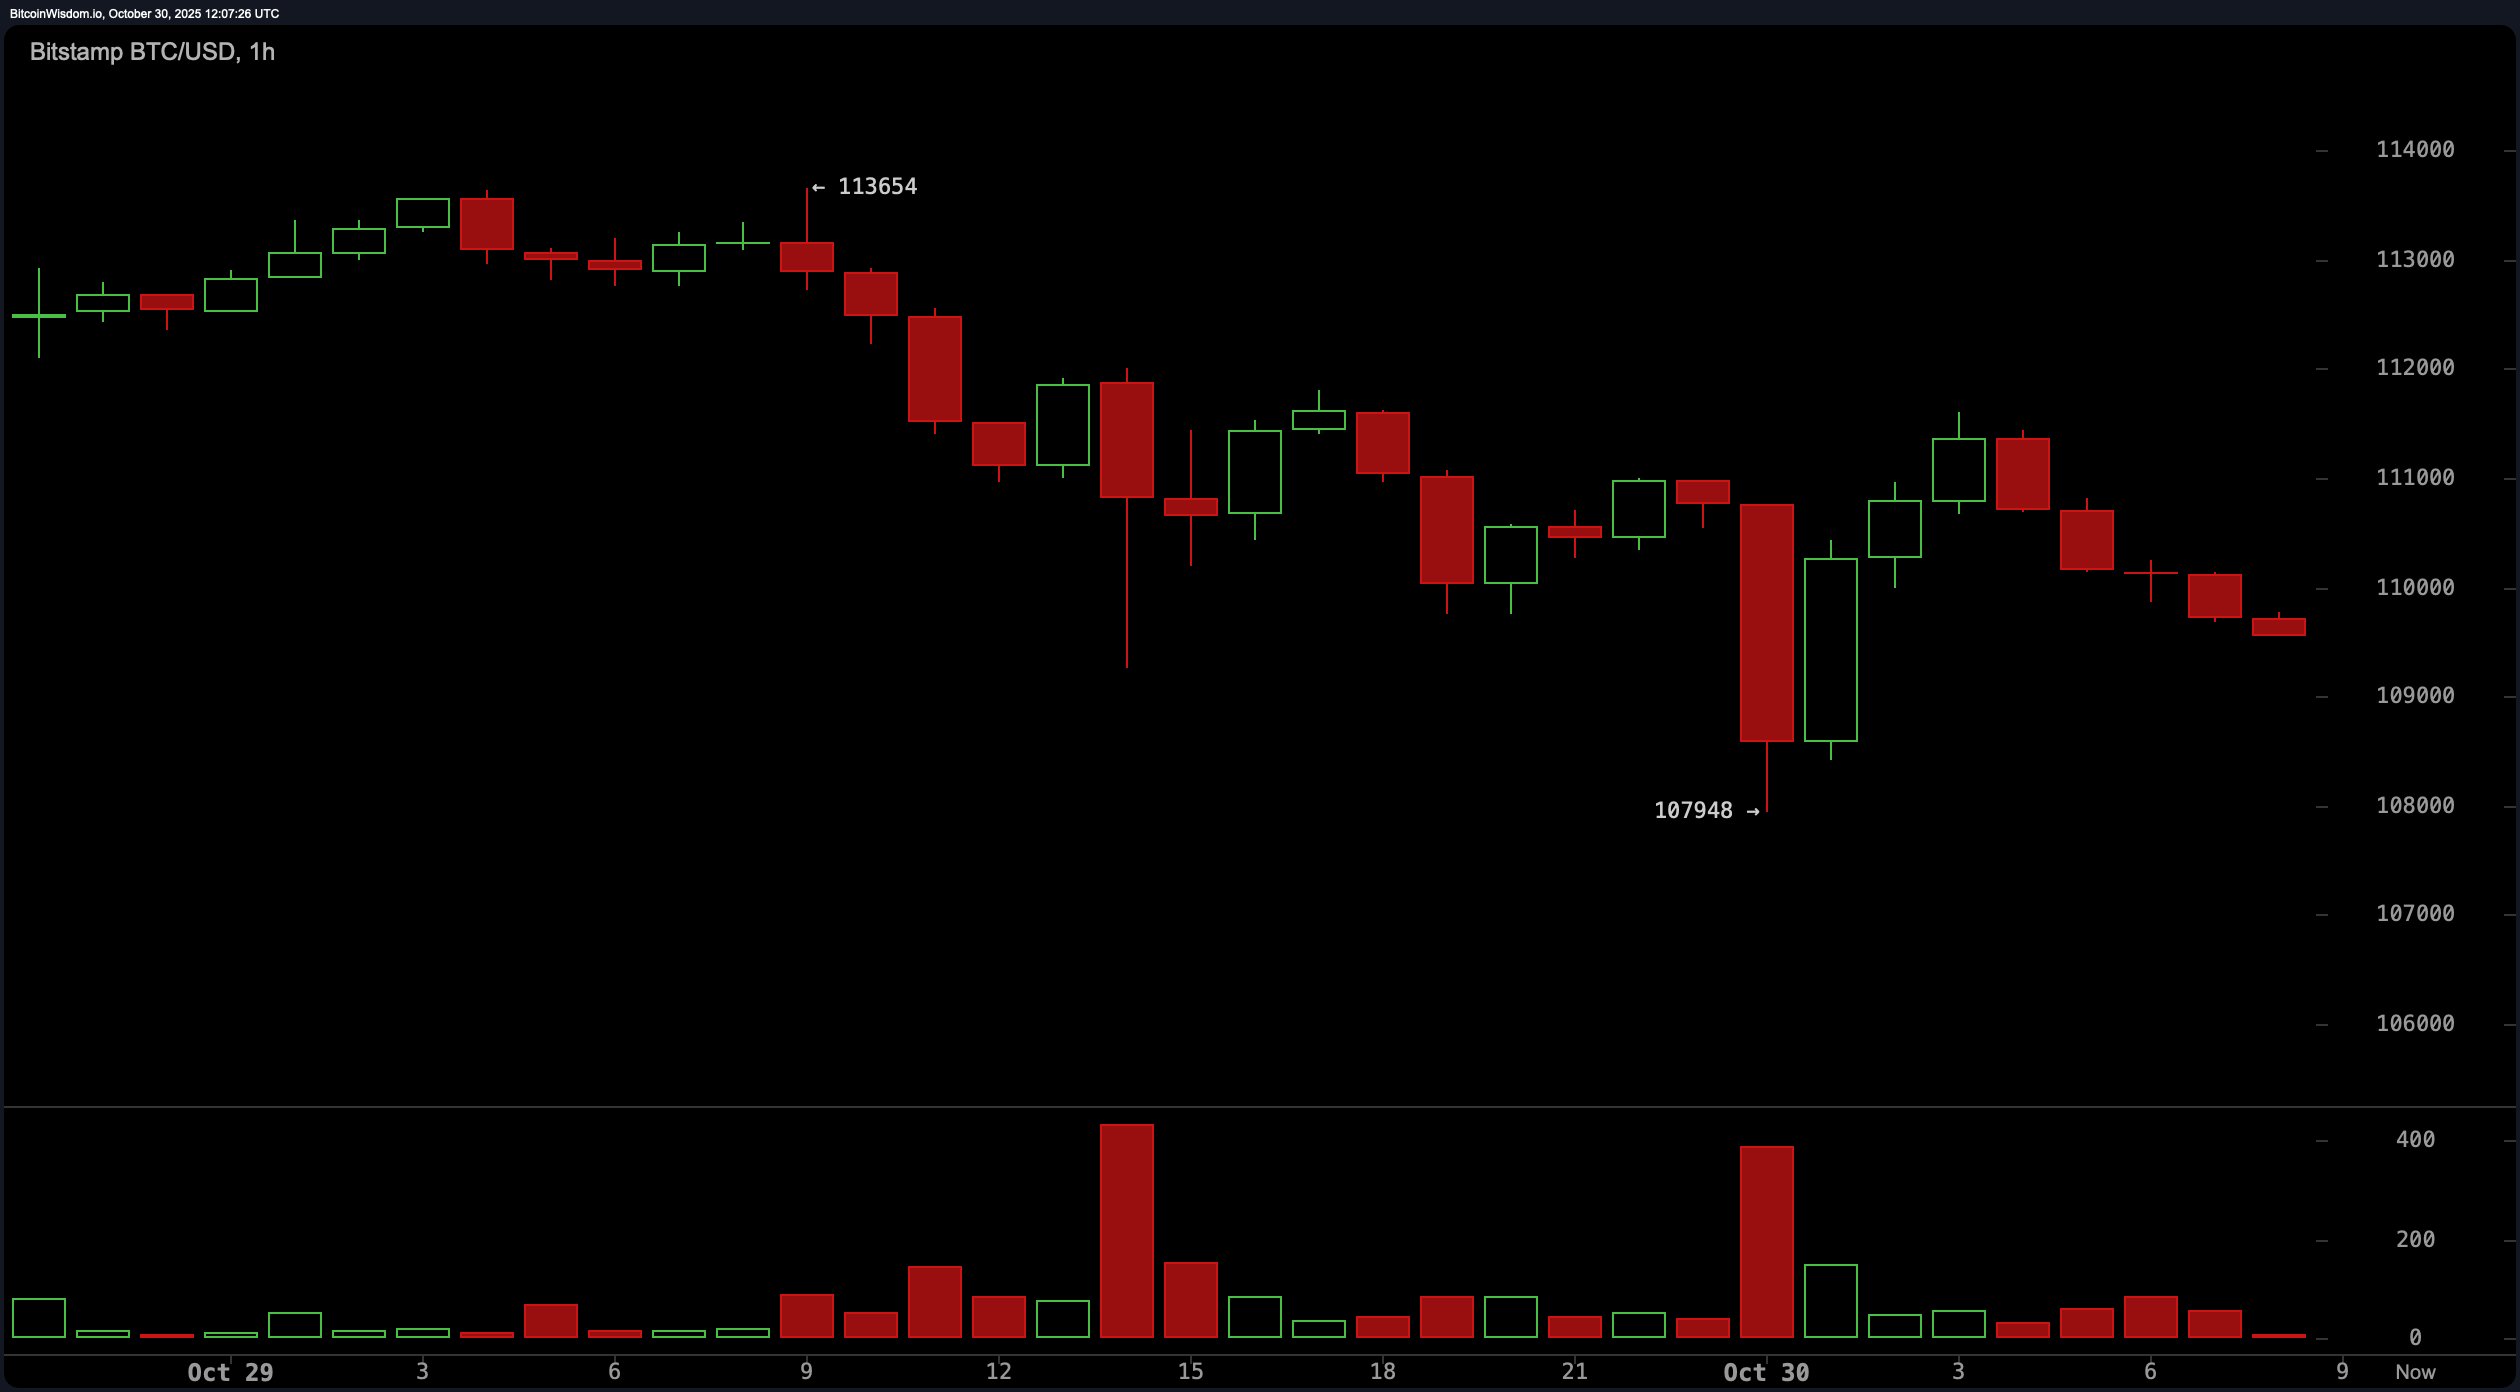
Let’s start with the hourly chart, where consolidation is the name of the game. Bitcoin is squeezed between $109,000 and $111,000, like a barbell mid-lift-poised for either a triumphant push or a dignified drop. A deep red candle followed by a gutsy green one implies that big players may be scooping up liquidity below, but the limp follow-through afterwards betrays a lack of conviction. 🧠💸
Momentum (−876.0) and the awesome oscillator (−1,273.0) both flash warning signs, while the relative strength index (RSI) at 44.1 tells us the bulls aren’t exactly benching new highs-more like lounging in the lobby. Until bitcoin escapes this zone, traders are stuck navigating a patience-testing range with scalp-worthy setups near the $107,950-$108,500 mark. 🧘♂️
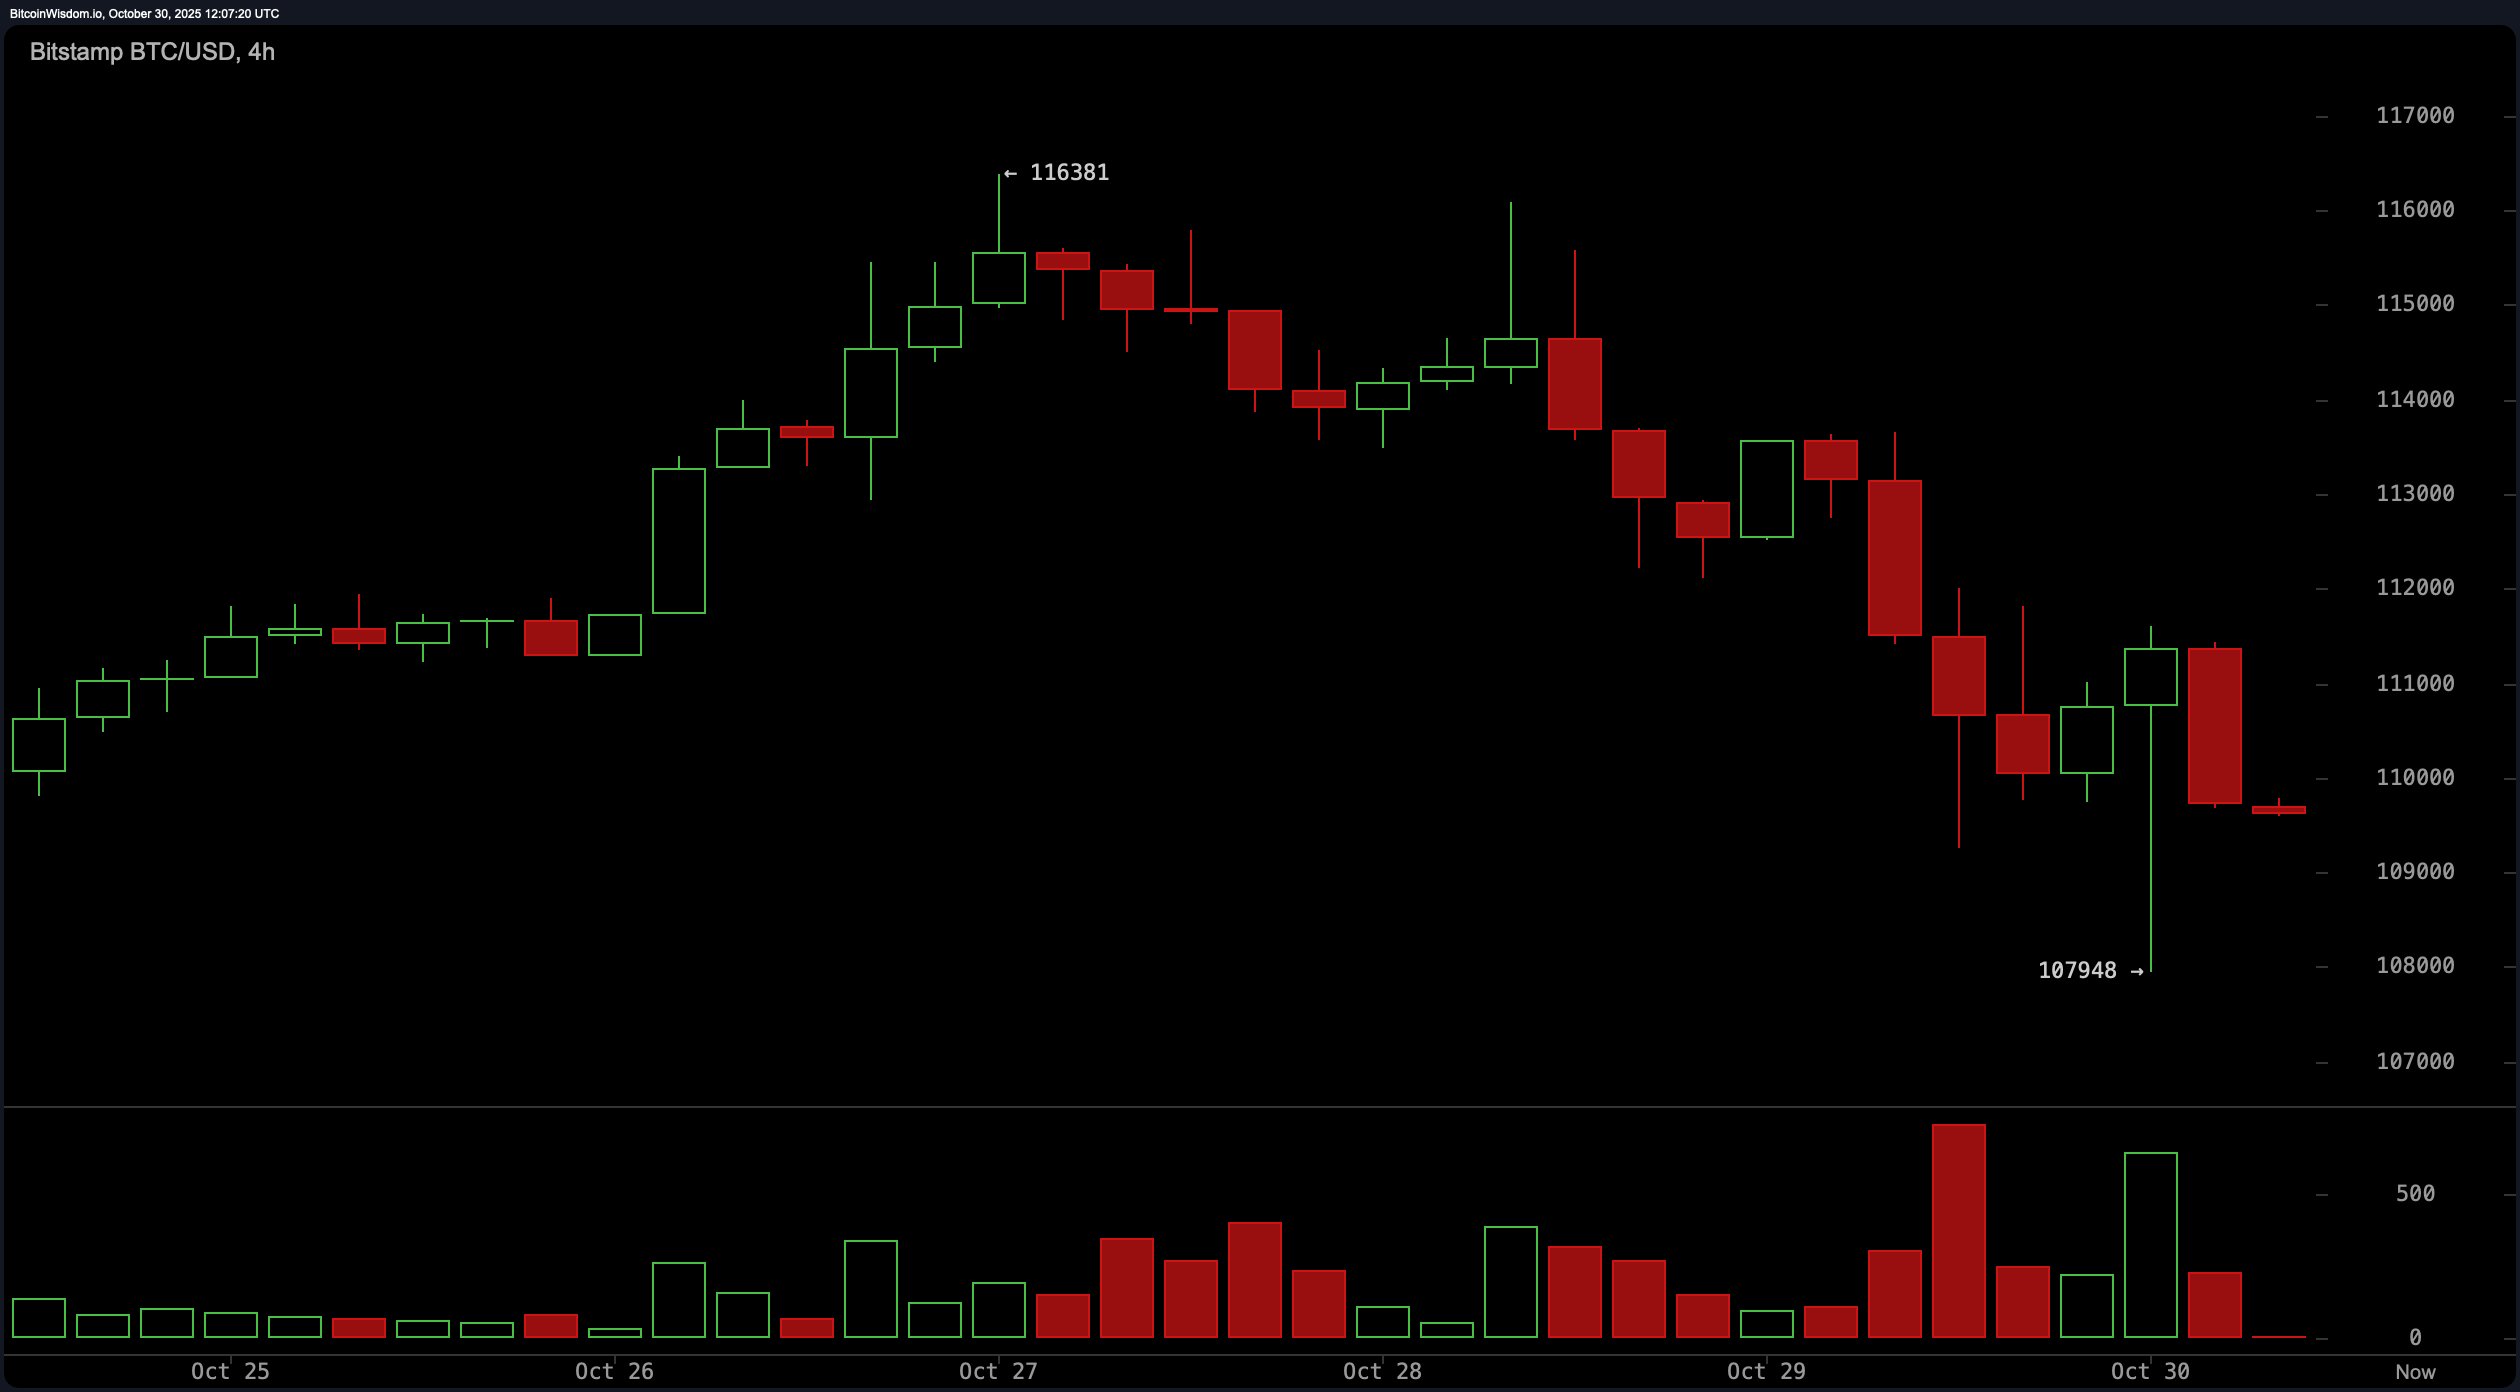
Zooming out to the four-hour timeframe, bearish footprints are stamped all over the chart. Rejection wicks and bearish engulfing candles point to a market allergic to highs, as if the very thought of ascending were a mortal sin. Price faced a hard slap at $116,381 and couldn’t quite get cozy above $113,000. A bounce from $107,948 hints at defensive buying, but it smells more like a reaction than an initiative. The commodity channel index (CCI) is resting at −37.2, and the average directional index (ADX) at 16.6 reinforces the lack of trend strength. If bitcoin can’t keep its footing above $108,000, brace for a visit to $105,000’s cold basement. ❄️
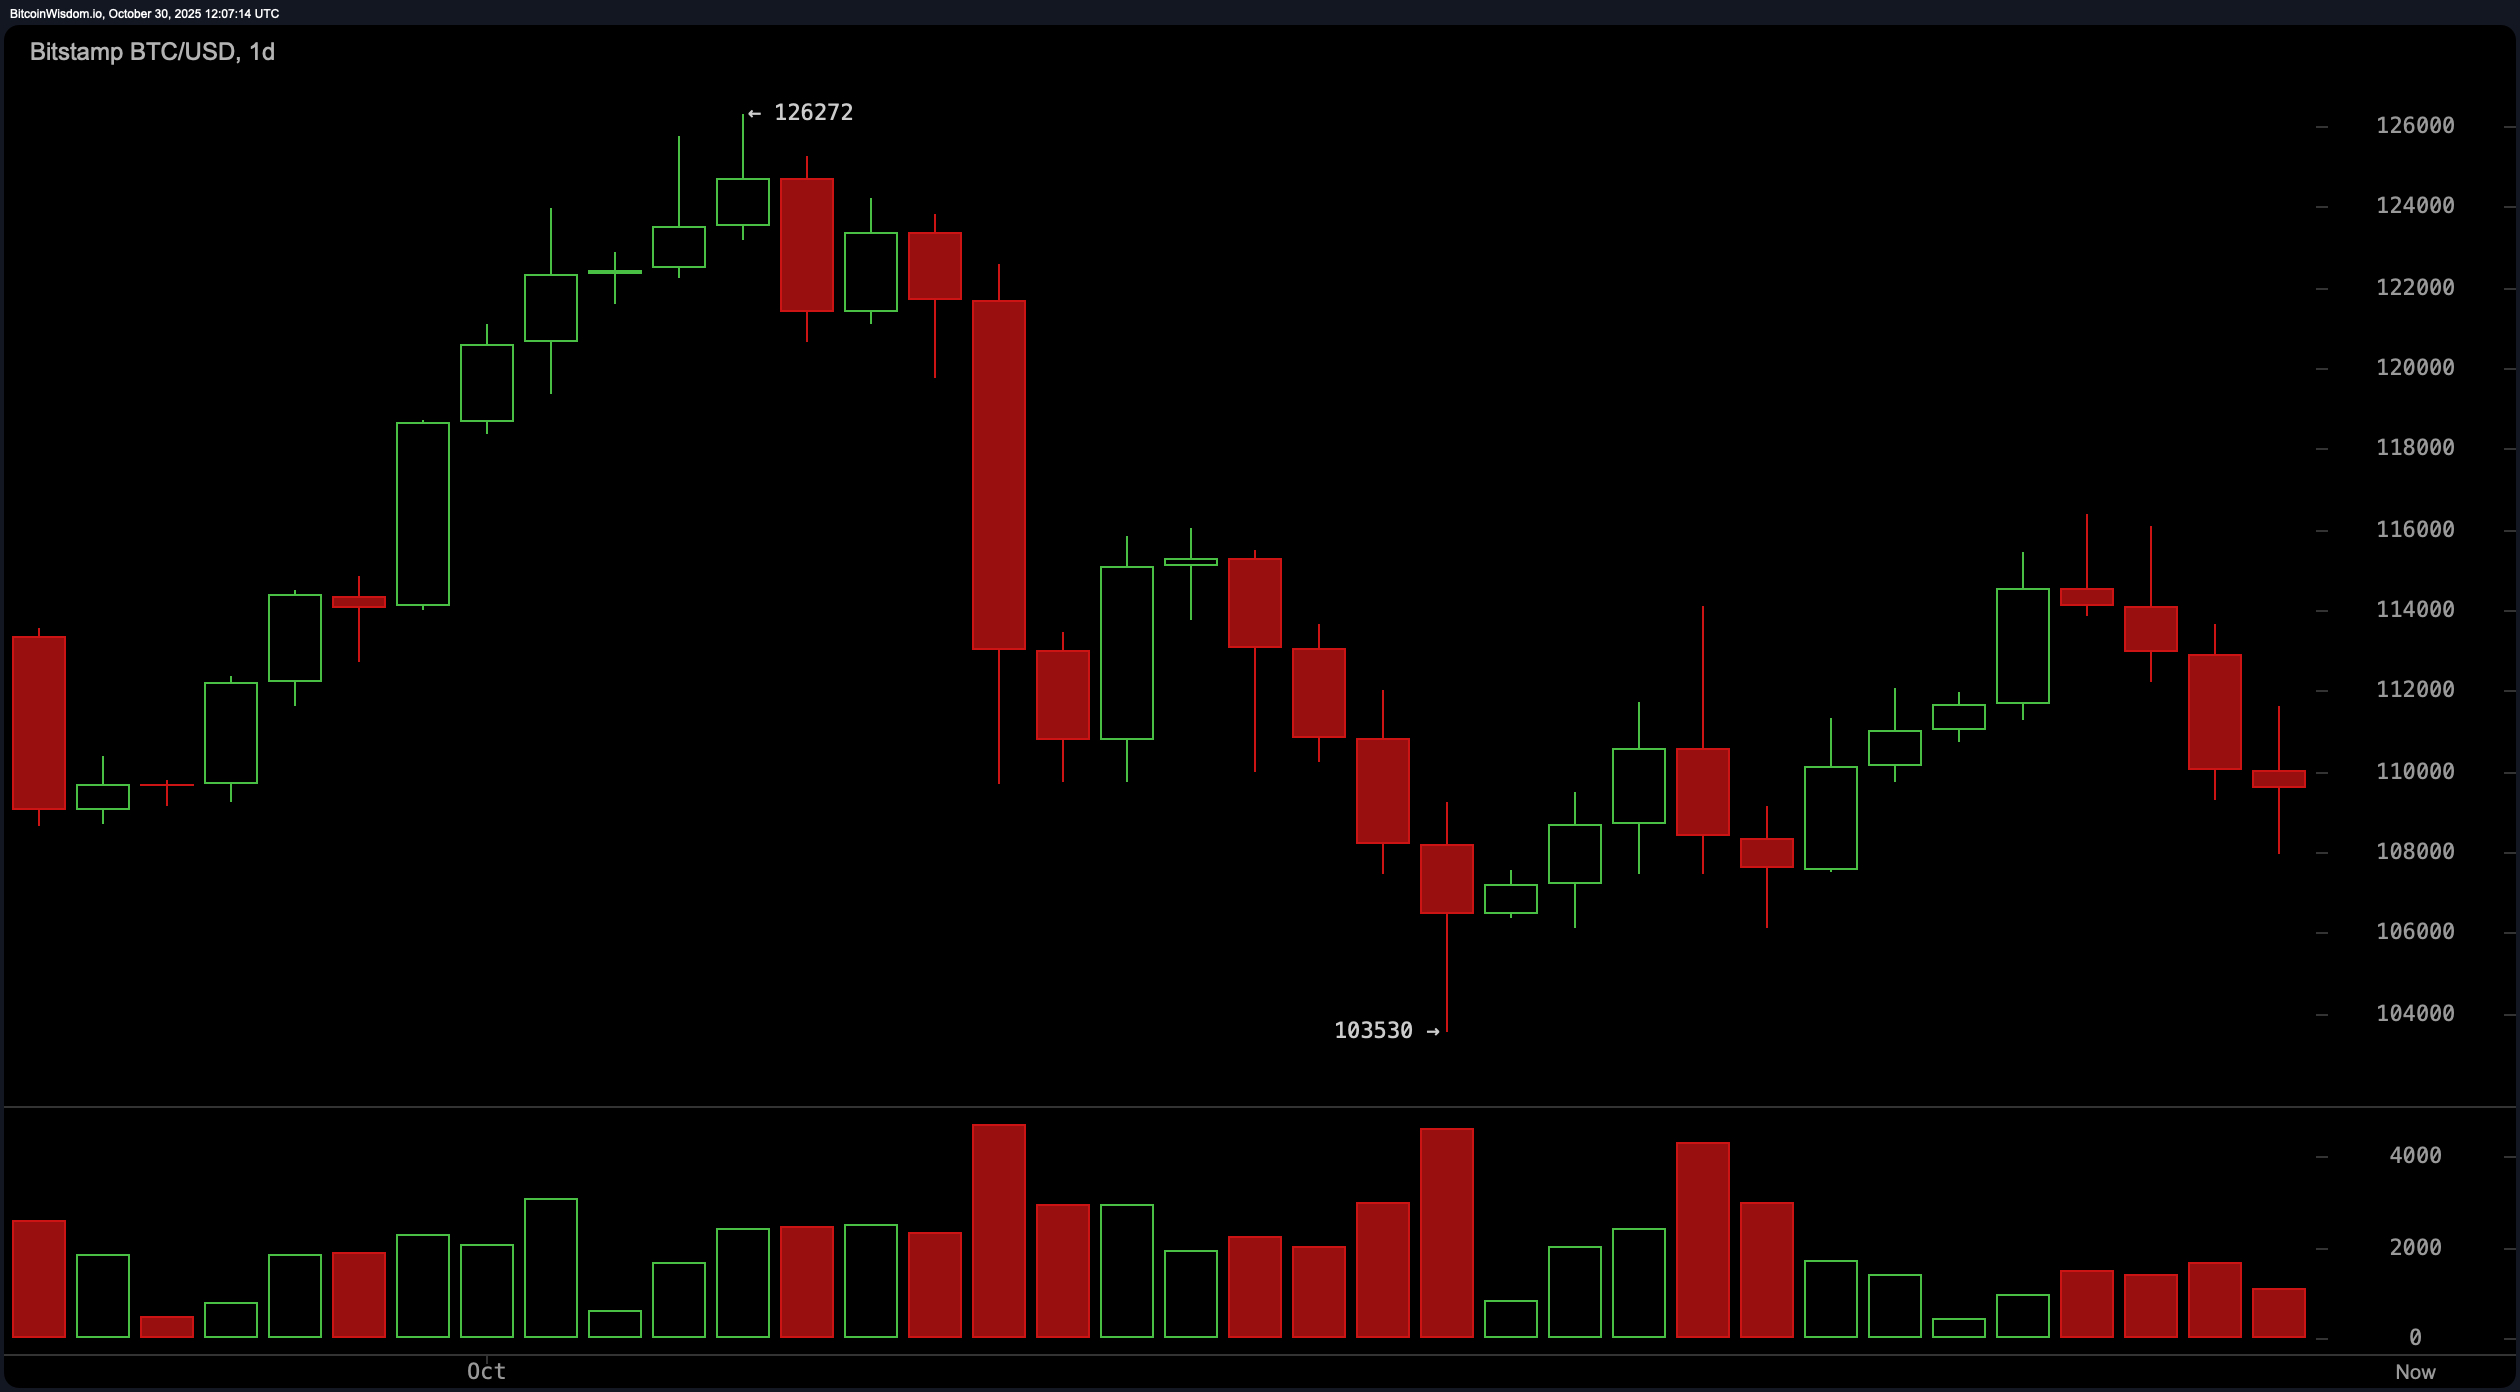
On the daily chart, the story leans even more heavily bearish. The market’s attempt to reclaim $120,000 was met with the grace of a belly flop, leading to a lower high and a firm rejection at $126,272. Distribution volume at recent highs suggests whales were unloading, not building. Bitcoin is currently hovering like a hesitant skydiver at $110,000, unsure whether to pull the chute or enjoy the free fall. With the exponential moving average (EMA) and simple moving average (SMA) across all short-to-mid timeframes (10 through 100 periods) throwing up red flags, there’s no technical lifeline until $103,500-the last known bounce zone. 🧗♂️
And here’s where things get particularly spicy: only the 200-period EMA ($108,378.7) and SMA ($109,379.1) are in bullish territory, which tells you this rally’s foundation is leaning dangerously on long-term trendlines. The moving average convergence divergence (MACD) is the lone bull in this pasture with a reading of −932.0-yes, it’s positive in action despite the negative value, hinting at a potential shift brewing beneath the surface. But let’s not confuse a whisper of optimism for a shout of reversal just yet. 🐯
Put it all together, and bitcoin is stuck in a technical tug-of-war. Oscillators are mostly neutral, momentum is missing in action, and moving averages are sharply skewed southward. The short-term bias leans bearish, and the volume profile backs that up-sellers are proactive, while buyers look more like tourists stumbling into the market on dips. A break below $103,500 could open the gates to a swift plunge toward the psychological support at $100,000. Until then, we watch, we wait, and we read the candles like cryptic love letters from the market. 💔
Bull Verdict:
If bitcoin can hold the $107,900-$108,500 support zone and attract real volume-not just dip-chasing tourists-it could stage a rebound toward $114,000. The moving average convergence divergence (MACD) is hinting at underlying bullish momentum, and with the 200-period moving averages still aligned to the upside, a recovery isn’t off the table. But bulls will need more than hope-they’ll need conviction and volume to reclaim control. 🤷♂️
Bear Verdict:
With a string of lower highs, exhausted momentum, and a parade of moving averages signaling downside across all key timeframes, bitcoin is skating on thin ice. Failure to defend $103,500 could accelerate a drop toward $100,000, where psychological support and technical structure collide. Until proven otherwise, the bears hold the steering wheel-white-knuckled and grinning, as if they’ve just won the lottery. 🎉
FAQ
- What is bitcoin’s current price today?
Bitcoin is trading at $109,769 as of October 30, 2025. - What is the bitcoin price range in the last 24 hours?
Bitcoin fluctuated between $108,201 and $113,536 in the past day. - Is bitcoin in a bullish or bearish trend right now?
Technical indicators currently lean bearish across most timeframes. - What key support and resistance levels should traders watch?
Support is at $107,900-$108,500, with resistance near $113,000-$114,000.
Read More
- Gold Rate Forecast
- USD CNY PREDICTION
- Silver Rate Forecast
- BNB Chain vs Ethereum: 2025’s EVM Showdown Ends With a Snore 🤯
- Norway’s Wealth Fund Meets Bitcoin: A Most Surprising Union 💸
- 🌴 Cayman Crypto Craze: DAOs Flock to Tax Haven Paradise! 🤑
- This Wormhole Tokenomics Thing Will Make You Rich-ish (Or At Least Smile)
- Ripple’s $1B Gamble: XRP’s New Empire or a Crypto Catastrophe? 🚀💸
- GBP RUB PREDICTION
- Brent Oil Forecast
2025-10-30 16:25