Ah, the sweet, sweet drama of cryptocurrency! The RENDER price prediction for 2025 is absolutely buzzing as Render Network flirts with a crucial, make-or-break support zone. Now, the darling of the Solana blockchain is keeping things exciting-yes, folks, it’s no longer with the Ethereum crowd. The migration is complete, and with it, the on-chain activity is holding up just fine, thank you very much. This month? The market structure is hinting at a breakout so juicy it could fuel a major rally that’ll have you clutching your pearls by late 2025 and into early 2026. Let’s just hope it’s not a mirage.
Render’s Solana Expansion: A Bold Move with Unexpected Consequences
The migration to Solana wasn’t just a subtle shift-it was a power move. Render Network is now enjoying the speed and low-cost execution of Solana, and it’s been quite the success this month. Why? Because it’s working, darling.
Hold on to your hats, because according to SOLSCAN, RENDER token transfers skyrocketed from 7,339 (worth $4.25M) on November 2 to a rather impressive 48,074 transfers worth $50.79M. It’s a surge-and not the kind you get from a cup of tea, but the kind that shakes up the entire network.
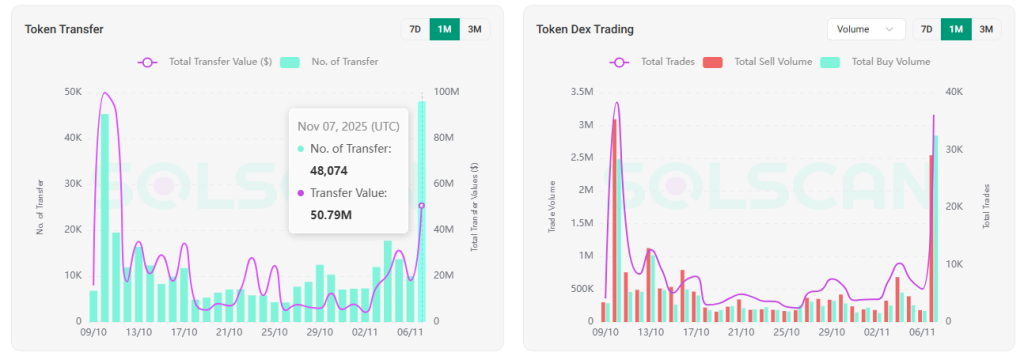
But wait, there’s more! DEX trading volumes are rising faster than a soufflé in the oven. Total trades jumped to 36,132 from a rather puny 3,948 earlier this week. And get this: buy volume has surpassed sell volume, sending the bears into a tizzy. When we checked, SOLSCAN revealed Buy volume at $2.84 million, while Sell volume lagged behind at $2.54 million. Oh, the drama!
Could this mean the bears are finally throwing in the towel? The stars are aligning, my friends, for a potential short squeeze. And let’s be real, who doesn’t love a good squeeze?
Liquidity Clusters: The Elusive Beacons of Profit
And then, the plot thickens. Enter the Coinglass liquidity heatmap, which reveals two juicy liquidity clusters that could serve as the magnet for RENDER/USD. One is hovering at $3.75, with $680.32K in liquidation leverage. The other? A much juicier $4.19 with $833.57K in leverage.
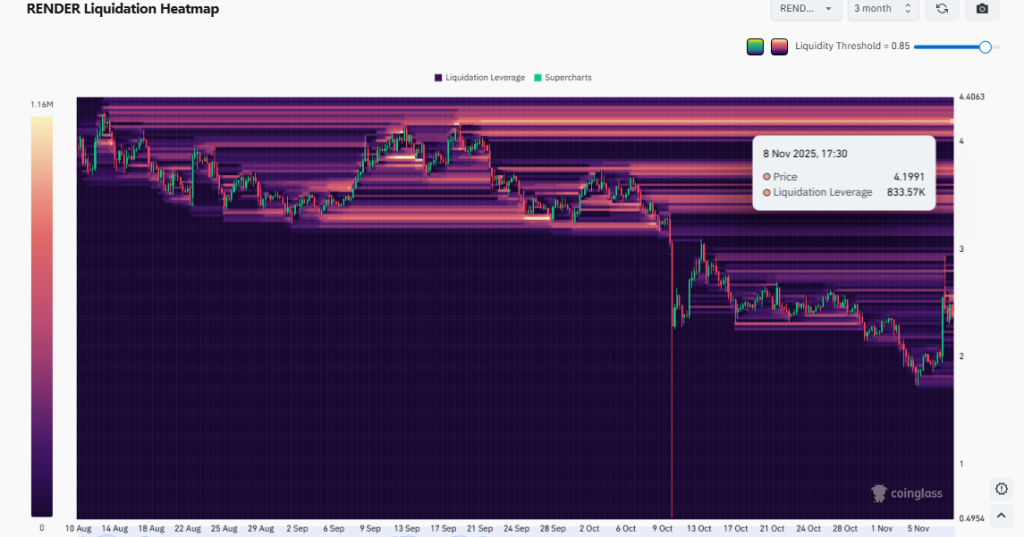
If bullish demand rises, prices often gravitate toward these liquidity pools. Translation? The upside might be ready to pounce. But who’s counting? Certainly not us.
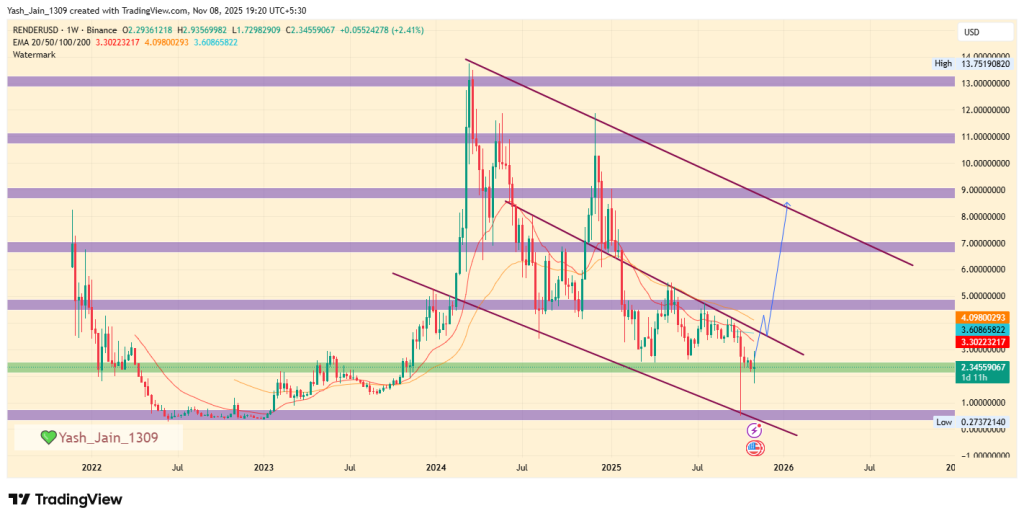
The RENDER price chart gives us a nice little breadcrumb trail to follow. The weekly pattern is a broad downward wedge that’s been unfolding since 2024, with support around $2.00-$2.50-historically, a solid zone to snag a bargain. If we see that $4.19 level get flipped with a dash of momentum, well, Render could be eyeing $9 by the end of the year, and even $13.75 in early 2026. That’s a breakout, darling, and we do love a good breakout!
Technical Indicators: The Mysterious Art of Accumulation
Now, before we all get too carried away, let’s talk technicals. Yes, the RSI at 36.63 does suggest we may be in oversold territory, and things might get a tad cooler (toward 30, if you must know). MACD and AO are still in “let’s wait and see” mode, indicating ongoing consolidation.
But-and here’s the kicker-Chaikin Money Flow (CMF) is at 0.09. What does that mean? Increased positive inflows. That’s right, darling, there’s some accumulation happening beneath the surface, even if the market’s playing coy about it.
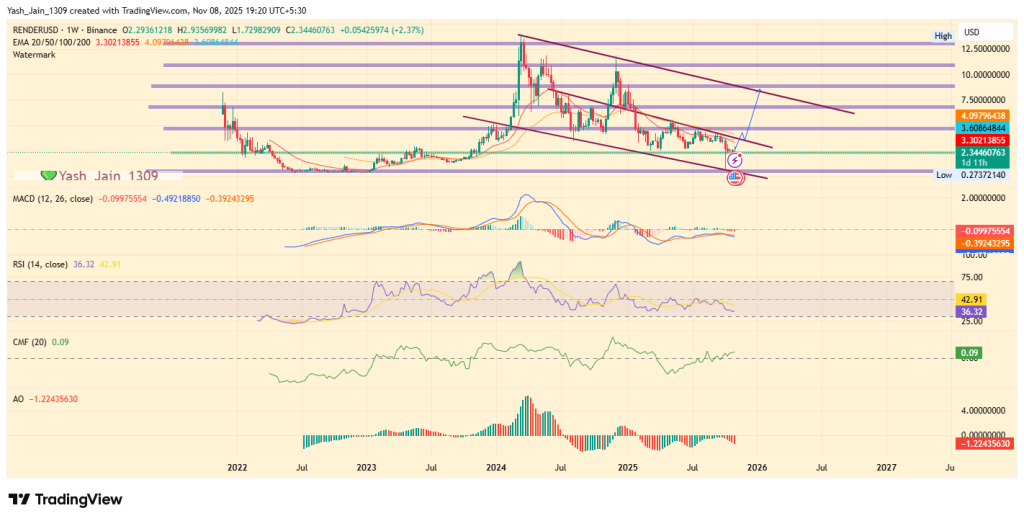
Mark my words: these conditions often precede a sharp rally once the supply thins out and demand surges. It’s a recipe for disaster-or, more likely, a delicious opportunity.
So, as market volume builds and RENDER holds its ground at critical support levels, the RENDER price prediction for 2025 looks rather promising. We’re talking a strong continuation rally, darling. And who doesn’t want a piece of that action?
Read More
- Brent Oil Forecast
- Gold Rate Forecast
- Is the Bitcoin Treasury ‘Bear Market’ Crisis Over? Analyst Has the Inside Scoop!
- When Binance Says “Goodbye” to MEMEFI, Chaos Ensues 🚀💸
- OpenSea Snags Rally: A Token Trade Tango with a Mobile Twist 📱💰
- Bitcoin Miners Go Green as AI Deals and Bitcoin Surge Create Perfect Storm
- CNY RUB PREDICTION
- Cardano vs. Quantum: Charles’ ‘Clinic’ Chaos
- Crypto’s Latest Sugar Daddy
- Silver Rate Forecast
2025-11-08 17:09