US inflation delivered its biggest downside surprise in months. Yet instead of a sustained rally, both Bitcoin and US equities sold off sharply during US trading hours.
The price action puzzled many traders, but the charts point to a familiar explanation rooted in market structure, positioning, and liquidity rather than macro fundamentals. Of course, the “explanation” is just code for “no one has a clue, but we’ll charge you $500/hour to sound smart about it.”
What Happened After the US CPI Release
Headline CPI slowed to 2.7% year over year in November, well below the 3.1% forecast. Core CPI also undershot expectations at 2.6%.
On paper, this was one of the most risk-positive inflation prints of 2025. Markets initially reacted as expected. Bitcoin jumped toward the $89,000 area, while the S&P 500 spiked higher shortly after the data hit. Because nothing says “risk-positive” like a brief dopamine hit followed by a full-blown panic attack.
That rally did not last. Because of course it didn’t. Why would it?
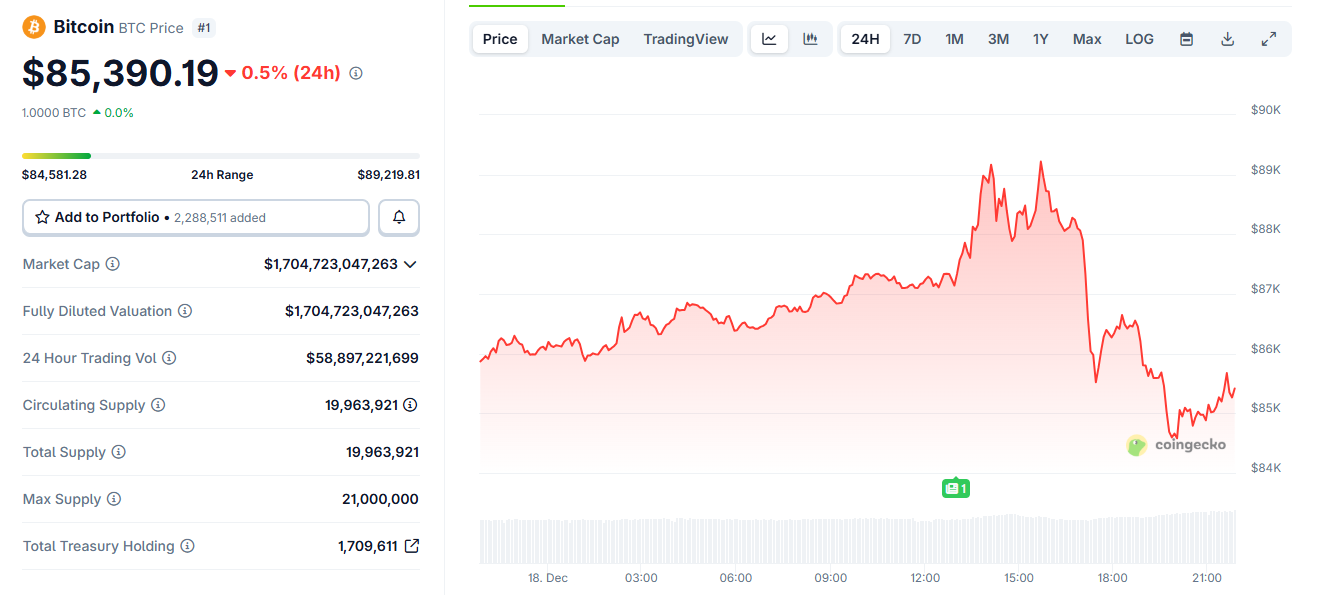
Within roughly 30 minutes of the CPI print, Bitcoin reversed sharply. After tagging intraday highs near $89,200, BTC sold off aggressively, sliding toward the $85,000 area.
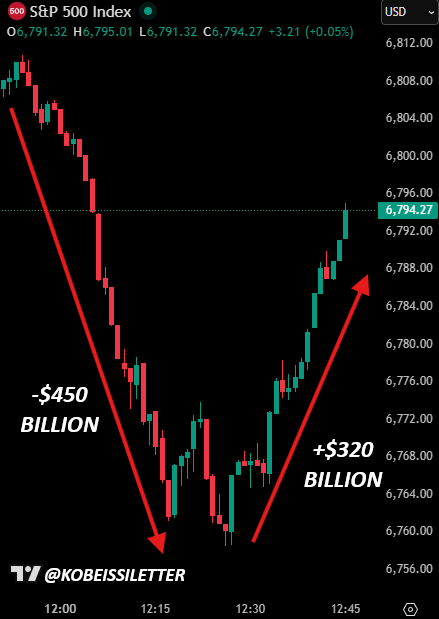
The S&P 500 followed a similar path, with sharp intraday swings that erased much of the initial CPI-driven gains before stabilizing. Because why settle for one rollercoaster ride when you can have two?
This synchronized reversal across crypto and equities matters. It signals that the move was not asset-specific or sentiment-driven. It was structural. Or, as I like to call it, “the universe laughing at your trading strategy.”
Bitcoin Taker Sell Volume Tells the Story
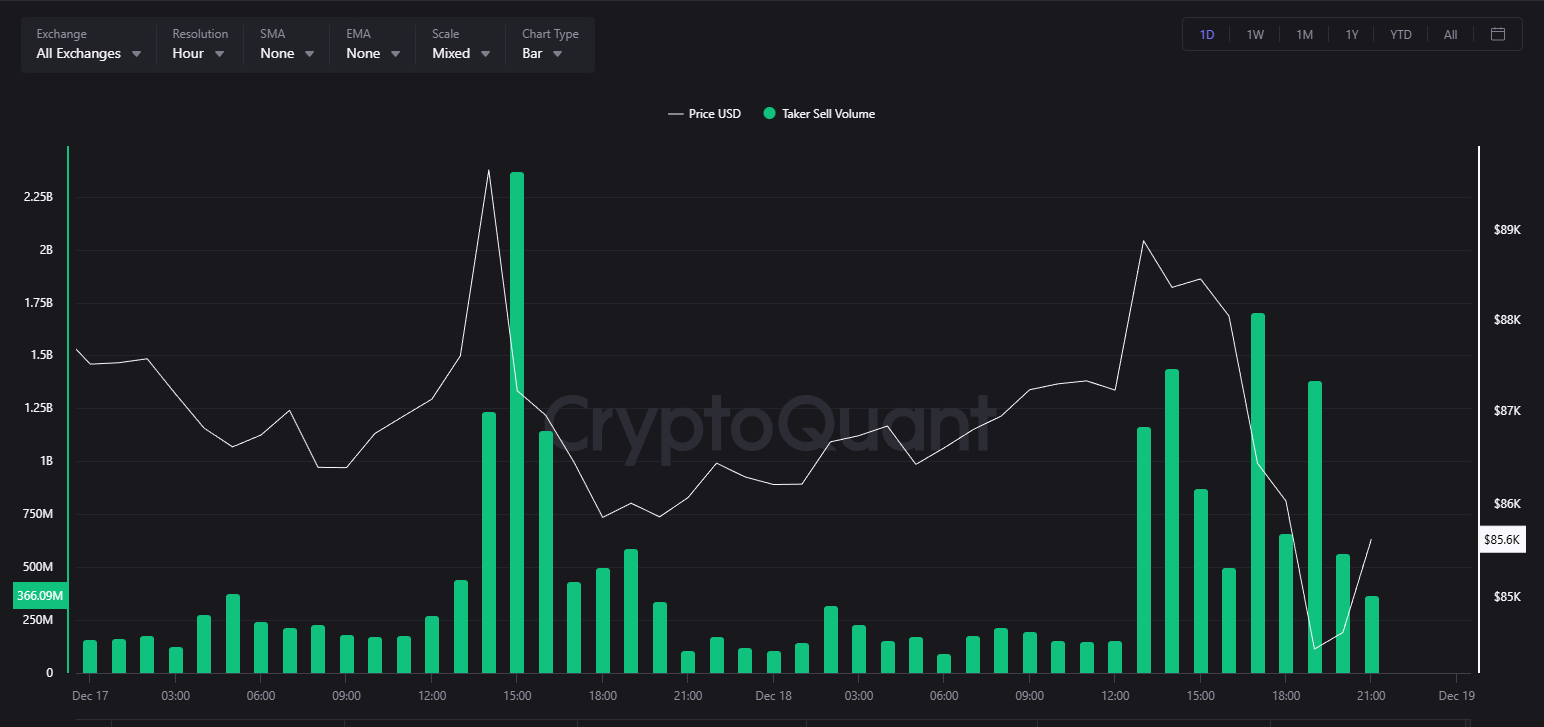
The clearest clue comes from Bitcoin’s taker sell volume data.
On the intraday chart, large spikes in taker sell volume appeared precisely as Bitcoin broke lower. Taker sells reflect market orders hitting the bid – aggressive selling, not passive profit-taking.
These spikes clustered during US market hours and coincided with the fastest part of the decline. Because why let a good day of trading ruin your Monday?
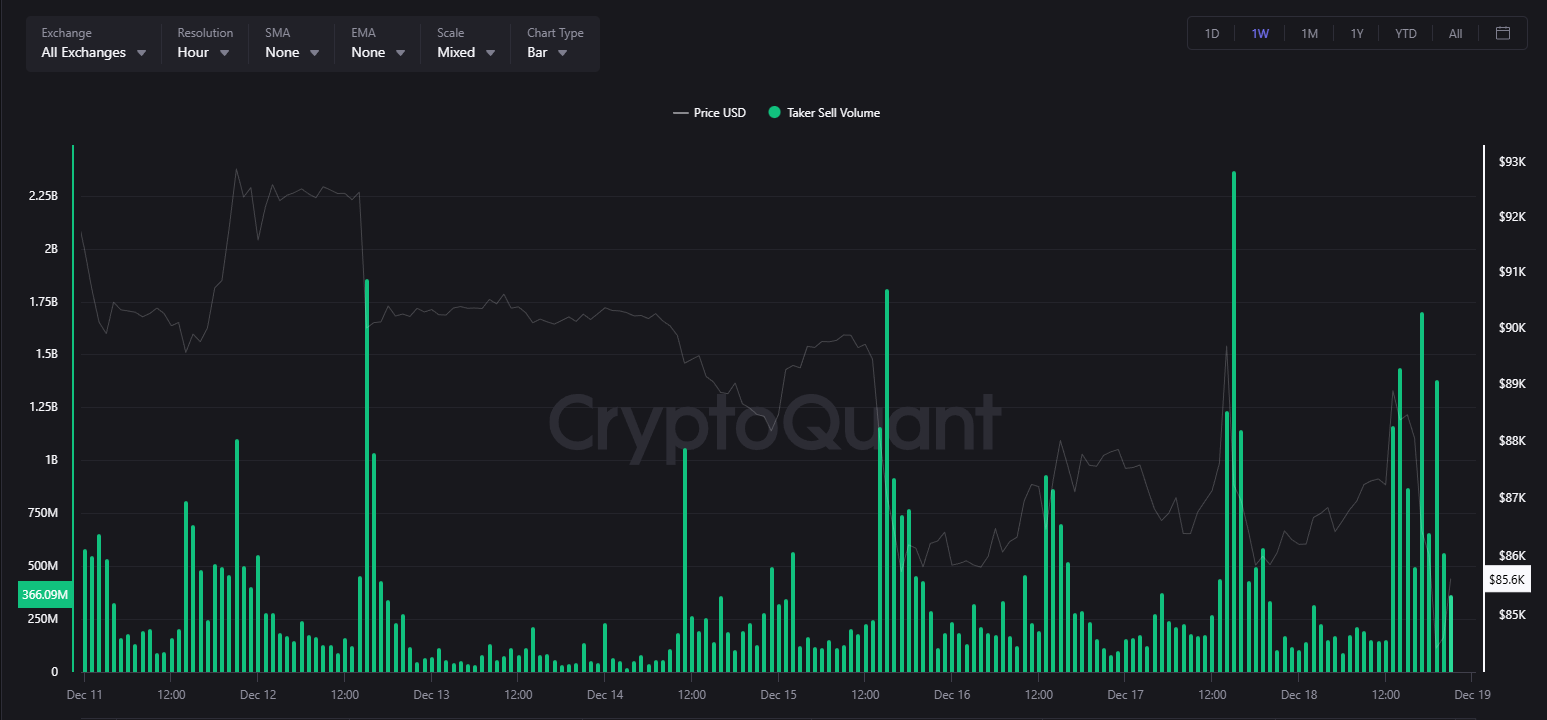
The weekly view reinforces this pattern. Similar sell-side bursts appeared multiple times over the past week, often during high-liquidity windows, suggesting repeated episodes of forced or systematic selling rather than isolated retail exits. Because nothing says “forced selling” like a robot programmed to panic at 3 PM on a Tuesday.
Why ‘Good News’ Became the Trigger
The CPI report did not cause the selloff because it was bad. It caused volatility because it was good.
Softer inflation briefly increased liquidity and tightened spreads. That environment allows large players to execute size efficiently.
Bitcoin’s initial spike likely ran into a dense zone of resting orders, stop losses, and short-term leverage. Once upside momentum stalled, price reversed, triggering long liquidations and stop-outs. Because nothing says “leverage” like gambling your life savings on a coin flip.
As liquidations hit, forced market selling amplified the move. This is why the decline accelerated rather than unfolded gradually. Because of course it did. Why would anything in finance ever go smoothly?
The S&P 500’s intraday whipsaw shows a similar dynamic. Rapid downside and recovery patterns during macro releases often reflect dealer hedging, options gamma effects, and systematic flows adjusting risk in real time. Or, as I prefer to call it, “the stock market’s version of a midlife crisis.”
🚨 This is insane level of manipulation.
8:30 a.m.
CPI came in lower than expected.
– On the bullish CPI news, Bitcoin pumped $2217, from $87,260 to $89,477 in just 60 minutes.
– $70B added to the crypto market.
– $94 million worth of shorts liquidated.10:00 a.m.
The…
– Bull Theory (@BullTheoryio) December 18, 2025
Does This Look Like Manipulation?
The charts do not prove manipulation. But they show patterns commonly associated with stop-runs and liquidity extraction:
- Fast moves into obvious technical levels
- Reversals immediately after liquidity improves
- Large bursts of aggressive selling during breakdowns
- Tight alignment with US trading hours
These behaviors are typical in highly leveraged markets. The most likely drivers are not individuals, but large funds, market makers, and systematic strategies operating across futures, options, and spot markets. Their goal is not narrative control, but execution efficiency and risk management. Or, as I like to call it, “the art of pretending you’re not panicking.”
In crypto, where leverage remains high and liquidity thins quickly outside key windows, these flows can look extreme. Because why not make it harder for retail investors to lose money? That’s just common decency.
🚨 THEY ARE MANIPULATING BITCOIN AGAIN AND I HAVE EVIDENCE!!!
Bitcoin dumped $4000 in minutes…
and almost no one actually understands what just took place.
It’s the same group of players manipulating the price… AGAIN.
Stop looking at charts, YOU NEED TO CHECK THE OUTFLOWS.…
– NoLimit (@NoLimitGains) December 18, 2025
What This Means Going Forward
The selloff does not invalidate the CPI signal. Inflation genuinely cooled, and that remains supportive for risk assets over time. What the market experienced was a short-term positioning reset, not a macro reversal. Because nothing says “reset” like losing 4% of your portfolio in 30 minutes.
In the near term, traders will watch whether Bitcoin can stabilize above recent support and whether sell-side pressure fades as liquidations clear.
If taker sell volume subsides and price holds, the CPI data may still assert itself over the coming sessions. Or it may just keep laughing at you while you stare at your screen, wondering if you made a mistake buying a coffee today.
Read More
- Silver Rate Forecast
- Brent Oil Forecast
- OpenSea Snags Rally: A Token Trade Tango with a Mobile Twist 📱💰
- Gold Rate Forecast
- Cardano vs. Quantum: Charles’ ‘Clinic’ Chaos
- Crypto’s Latest Sugar Daddy
- When Binance Says “Goodbye” to MEMEFI, Chaos Ensues 🚀💸
- Bitcoin Miners Go Green as AI Deals and Bitcoin Surge Create Perfect Storm
- Is the Bitcoin Treasury ‘Bear Market’ Crisis Over? Analyst Has the Inside Scoop!
- ETFs Defy Market Plunge: Can Cryptocurrency Survive the Drama? 🤑📉
2025-12-19 01:34