Bitcoin Chart Outlook
Bitcoin is holding at $67,312, with a market cap of $1.32 trillion and 24-hour trading volume clocking in at a thunderous $160 billion. The price range has swung dramatically between $60,000 and $70,546-classic whiplash territory for anyone with weak hands or slower reflexes.
Bitcoin Chart Outlook
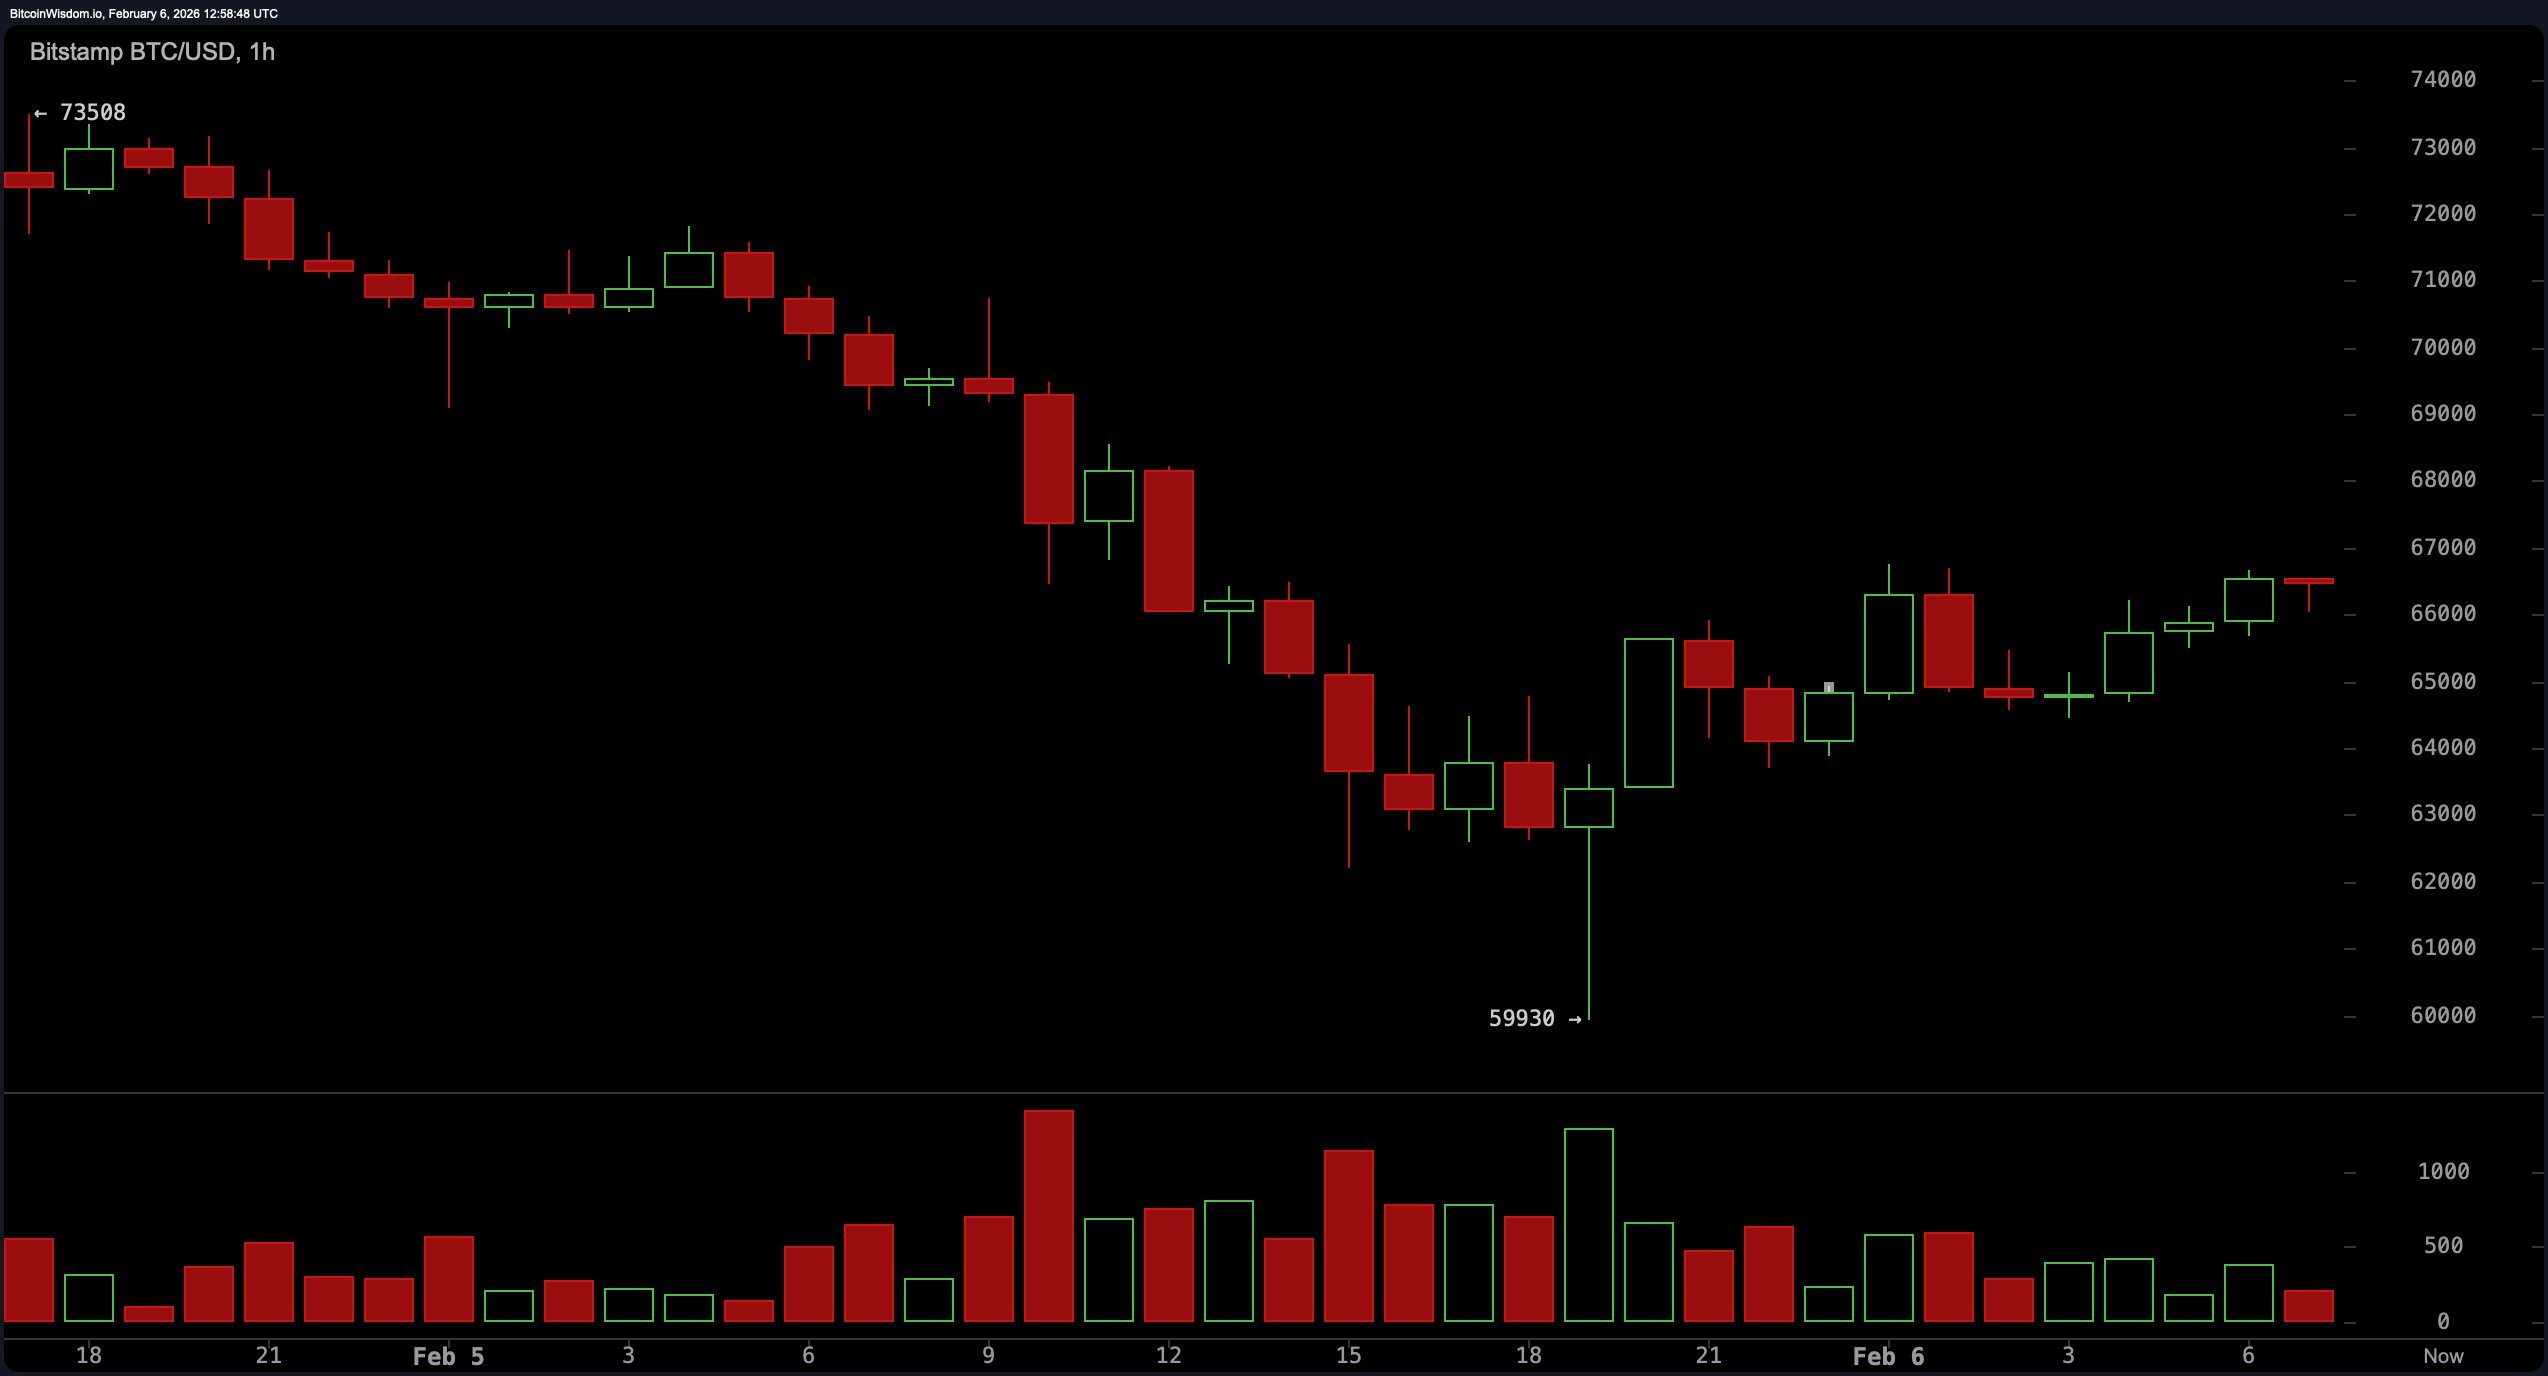
Bitcoin’s technical landscape on Feb. 6, 2026, is a cocktail of volatility and hesitation, garnished with a side of bear claws. The 1-hour chart shows early signs of stabilization with higher lows forming off the $60K base, suggesting a modest comeback-but don’t cue the victory parade just yet. There’s no heavy volume riding shotgun with this bounce, meaning we’re in the realm of relief, not revival. Momentum is dampened near the $66,800 rejection zone, where sellers are still flexing, swatting away upside dreams without volume confirmation.
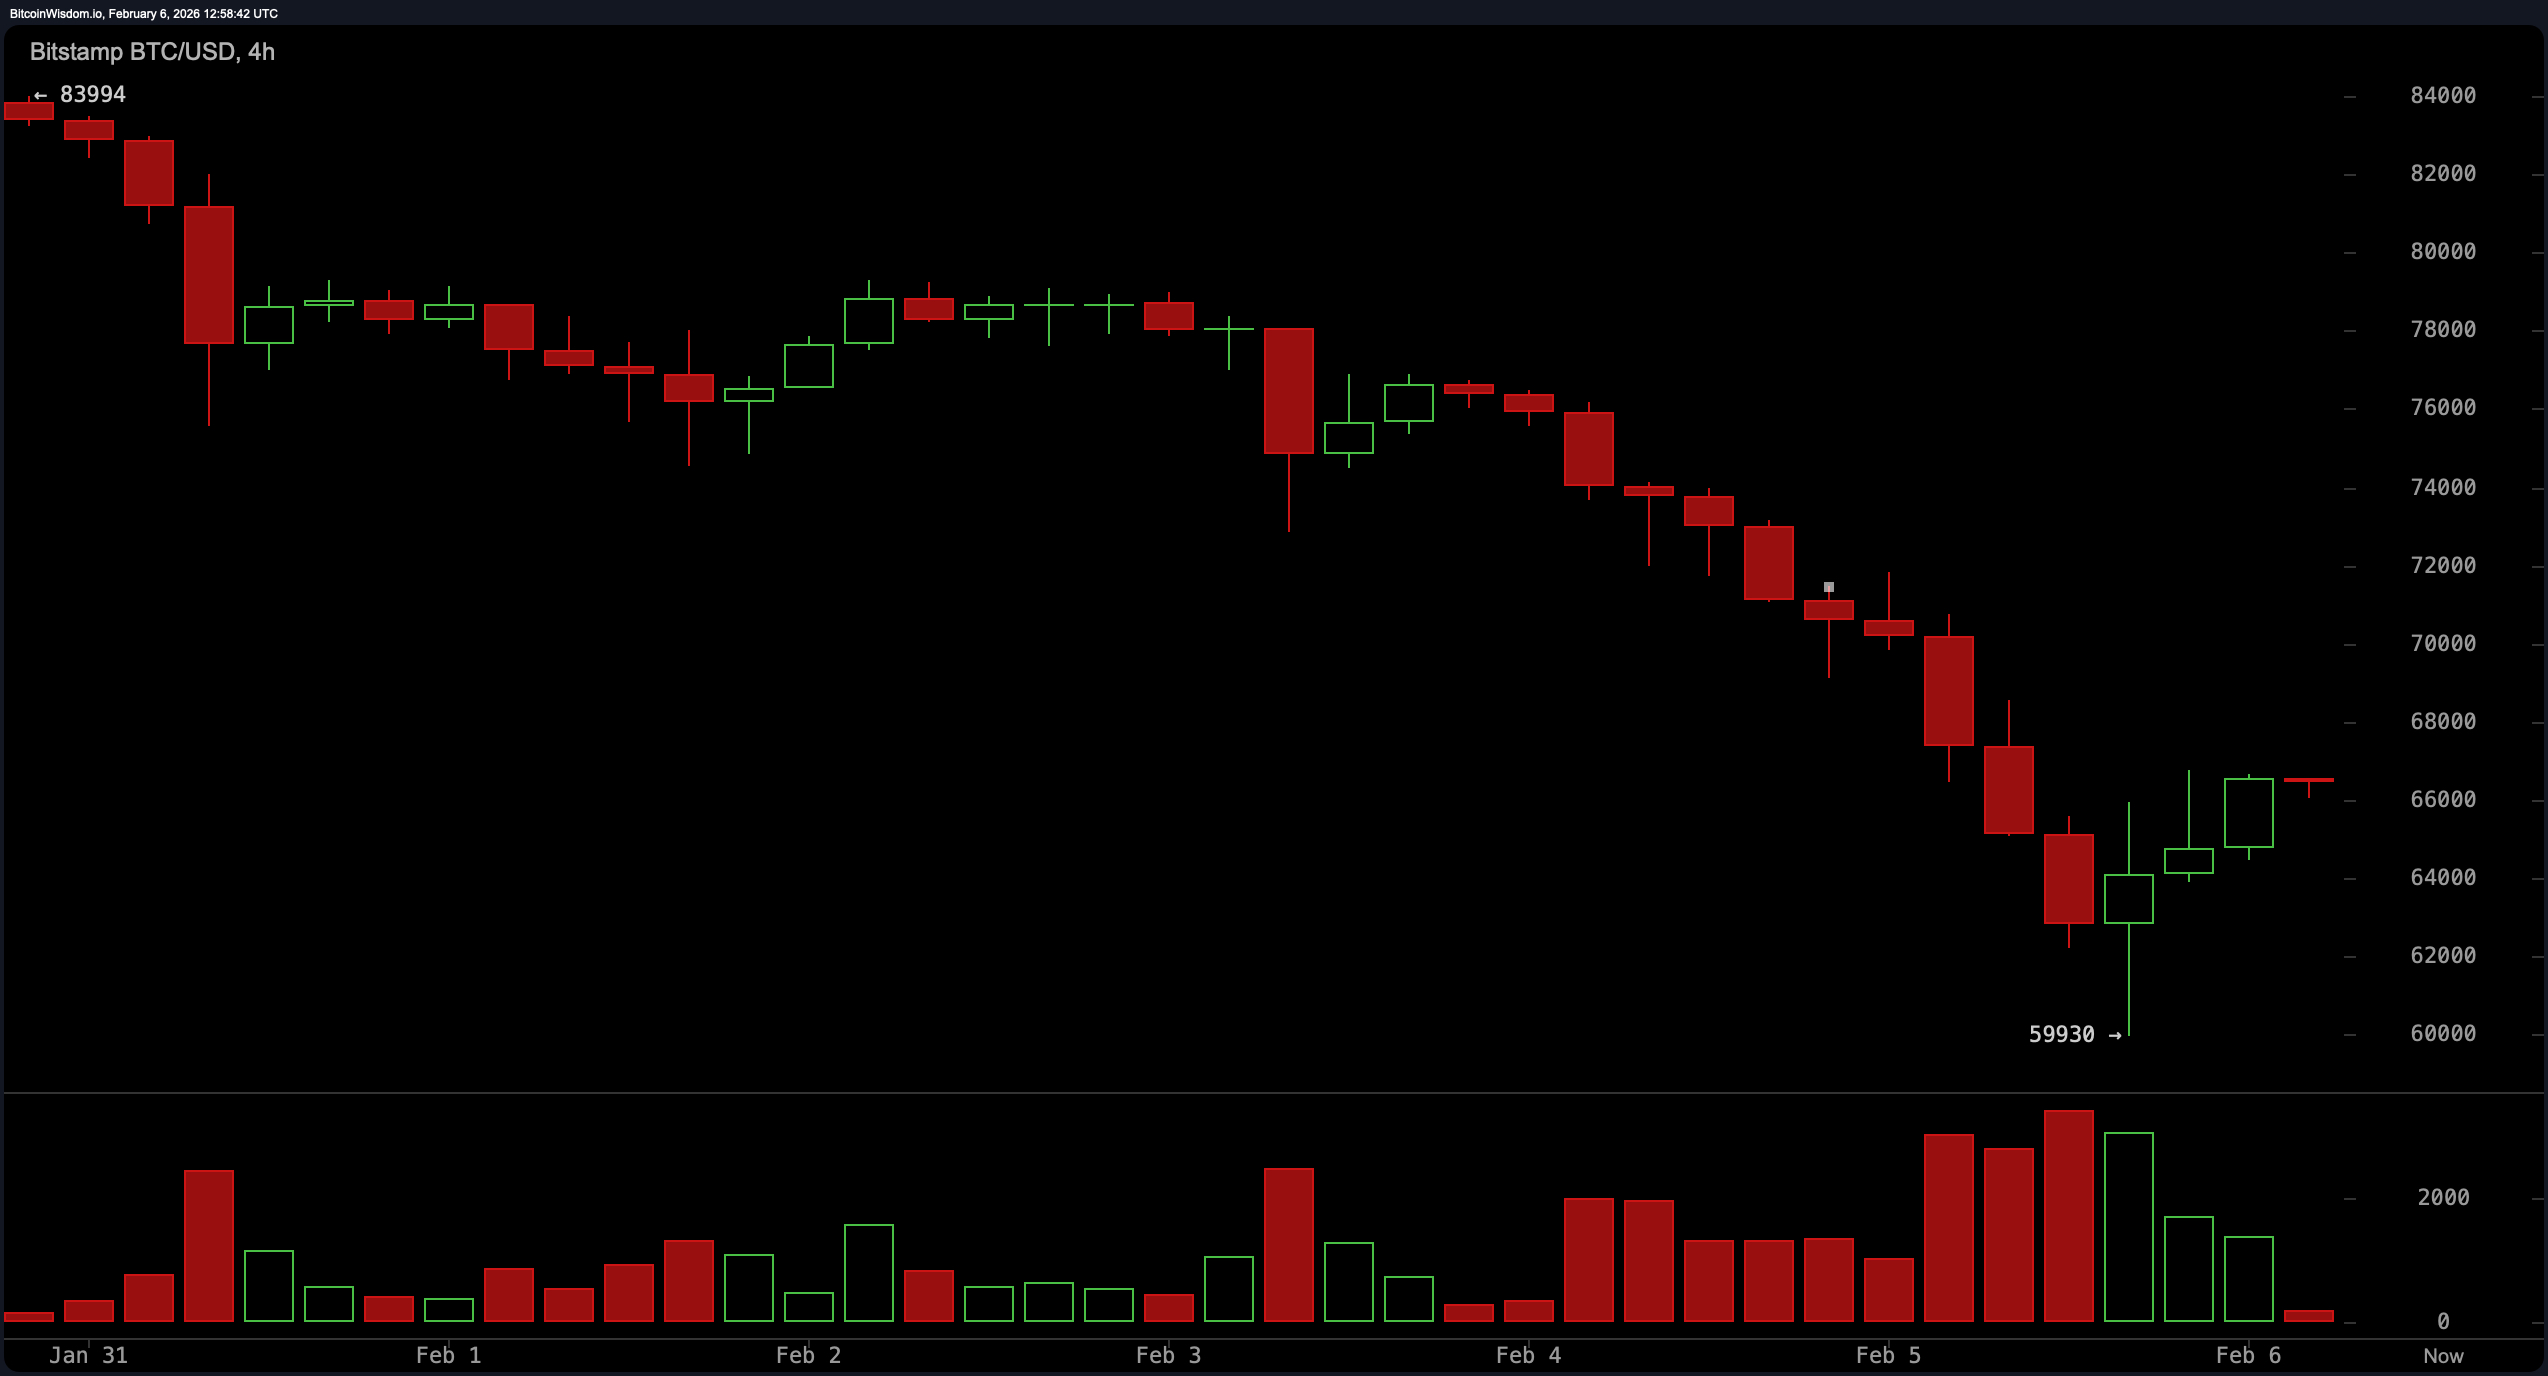
Over on the 4-hour chart, the tone shifts from tentative to tactically bearish. The structure continues to favor downside with a relentless parade of lower highs from the $84,000 region. A dramatic wick to $59,930 screamed capitulation before the bounce, but the price remains beneath every significant breakdown level. The volume profile during the drop was aggressive-this wasn’t profit-taking, it was panic selling with teeth. Resistance between $66,500 and $68,000 is the gatekeeper, and without a clean break, the trend remains tilted downward.
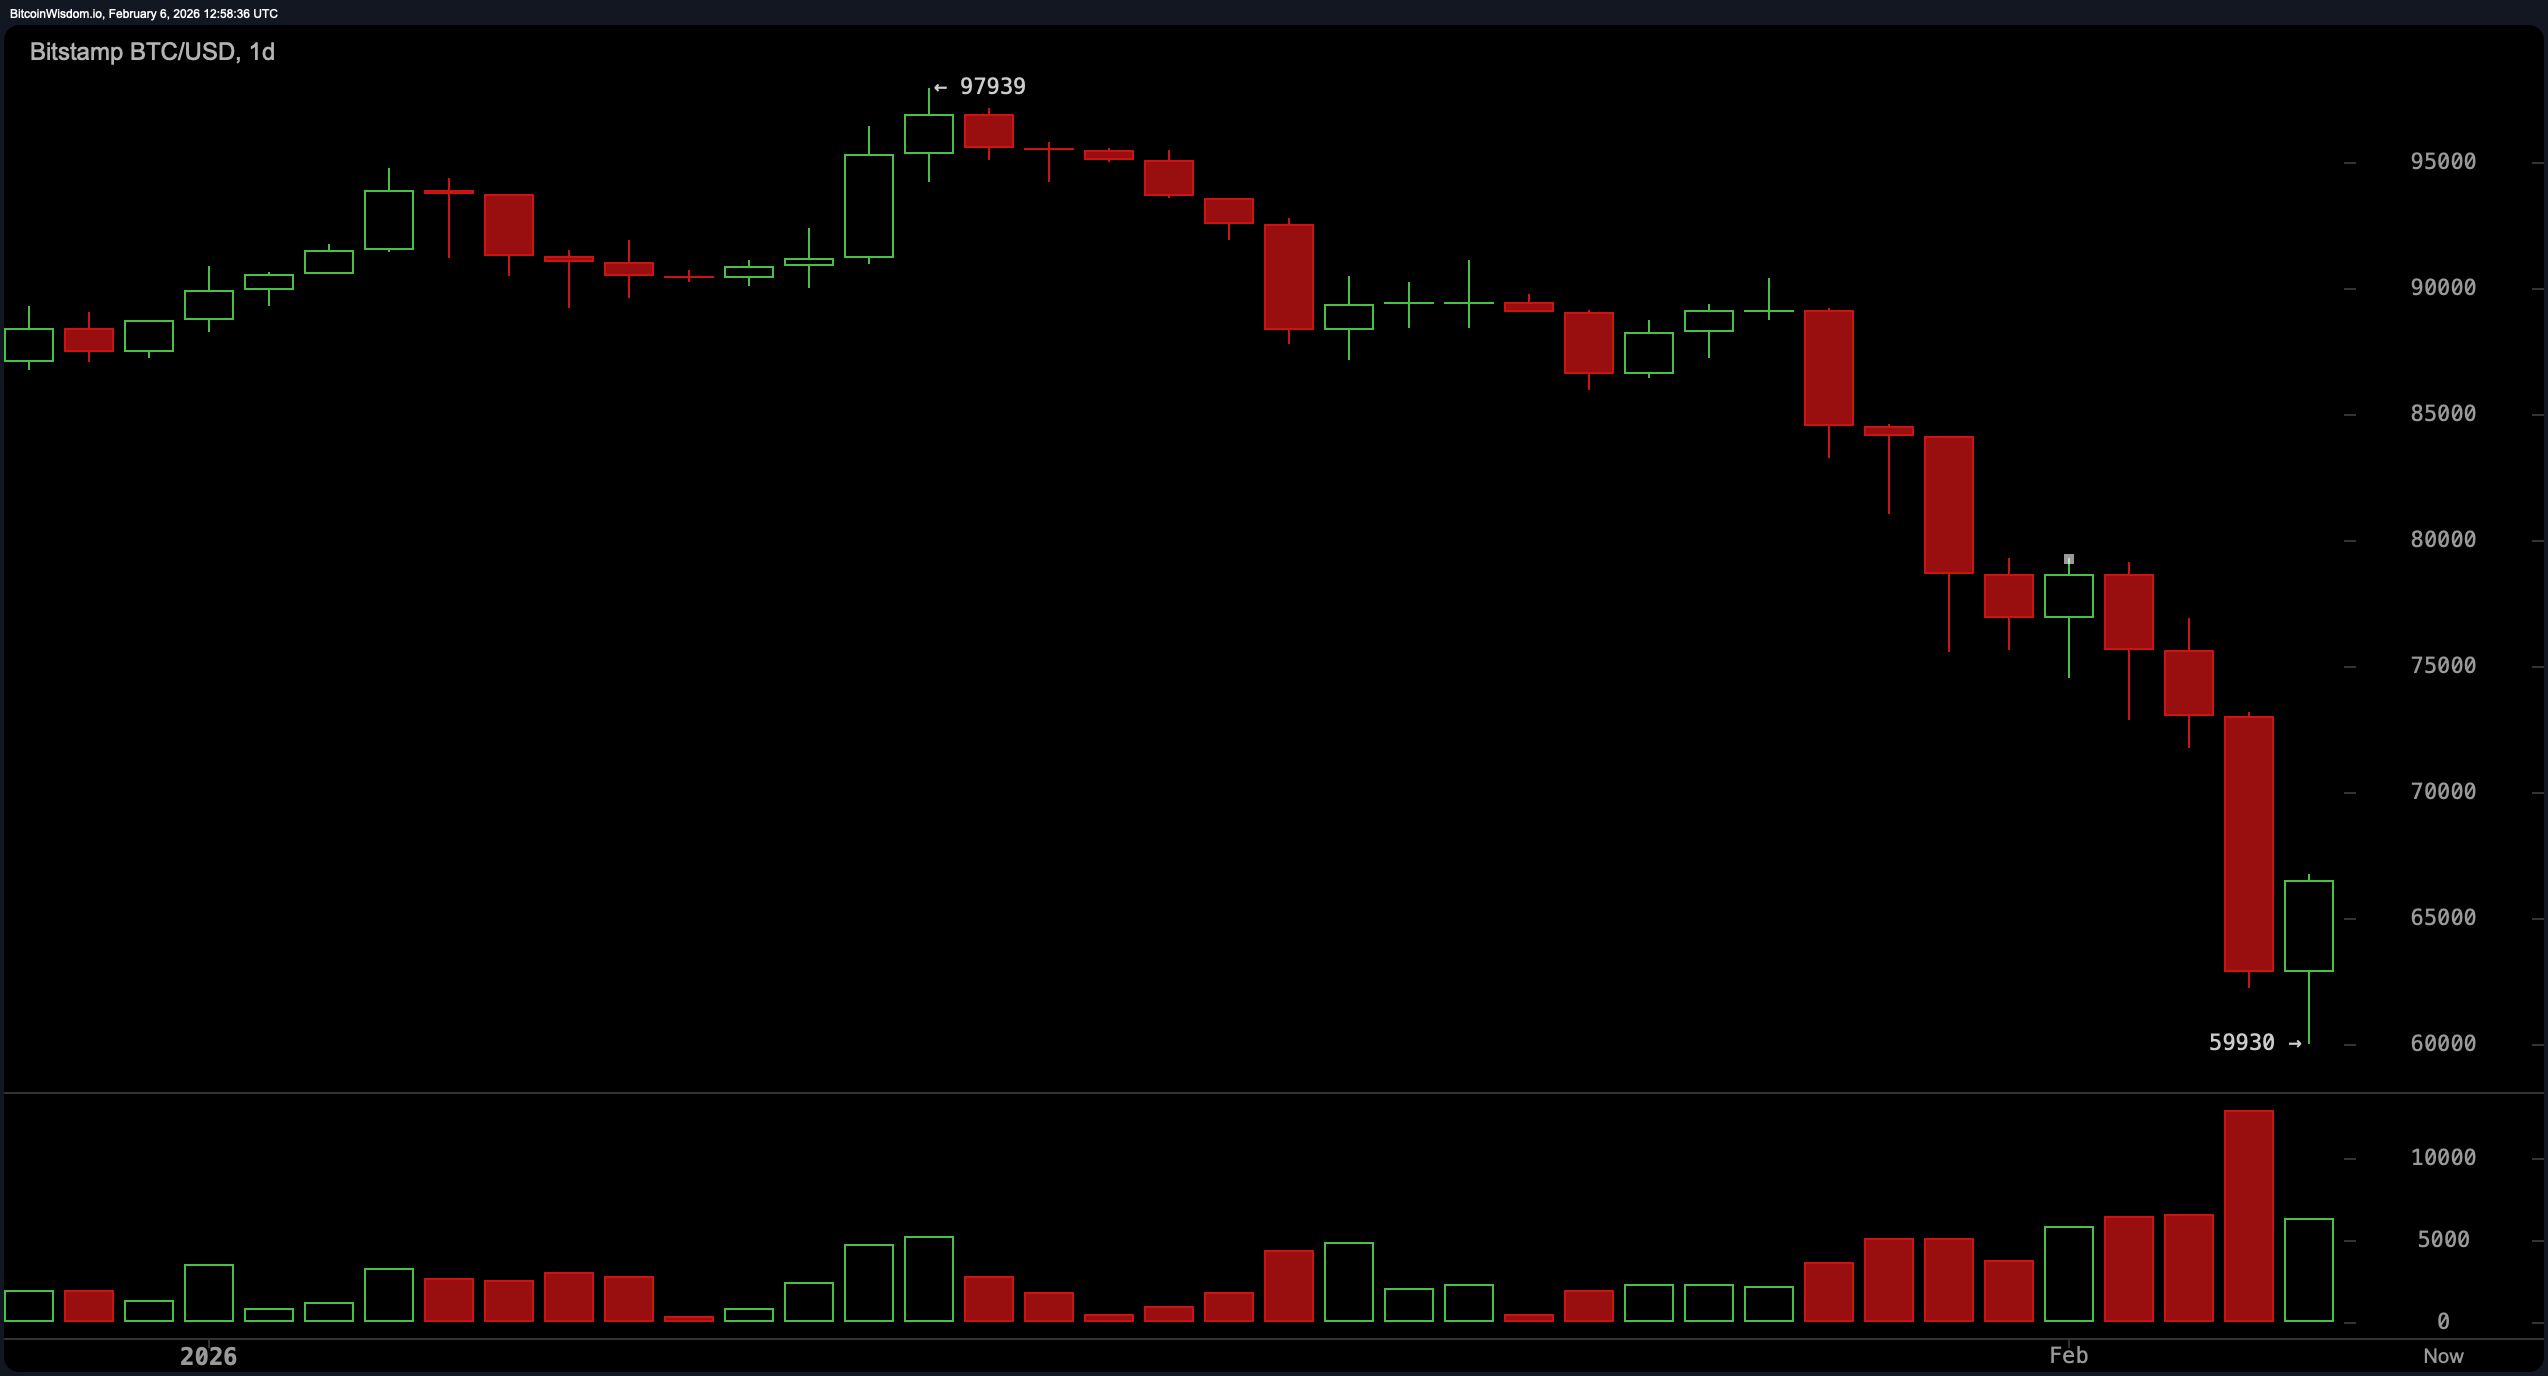
The daily chart paints an even grimmer picture. Bitcoin has slipped into a textbook lower-high, lower-low configuration after an ambitious but failed climb near $97,900. The flushing move to $59,930 was not subtle-it carried the stench of margin calls and stop-loss carnage. Support has held around $60,000-$62,000, but resistance between $66,000-$68,000 is like a grumpy doorman at the velvet rope, denying entry to any rally lacking conviction. The structure suggests that unless $68,000-$70,000 is reclaimed with high-volume swagger, any bounce should be treated with suspicion, not celebration.
Now, let’s talk indicators, where things get even spicier. The relative strength index (RSI) is languishing at 25-oversold and sulking in the corner. The commodity channel index (CCI) is deep in the basement at −181, while momentum sits at a downright sulky −22,604, both suggesting oversold territory but not necessarily a reversal. The moving average convergence divergence (MACD) is holding a nasty −5,733 reading-indicative of ongoing bearish crossover pressure. The Awesome oscillator, for all its swagger in name, is equally uninspired at −15,756. These oscillators scream exhaustion, but exhaustion isn’t the same as a trend shift-it’s just the market saying it’s tired, not that it’s changing its mind.
As for the moving averages, they’re all rolling their eyes at bitcoin’s current price. Every single major exponential moving average (EMA) and simple moving average (SMA) from the 10-period to the 200-period is glaring red. The 10-period EMA is perched at $75,232, while the 200-period SMA is sitting on a throne far above at $102,777. In other words, bitcoin is currently camping out way below its former glory, and the trend-following indicators haven’t budged an inch to suggest any change in the prevailing mood. Until this coin can claw back above those key resistance zones, the technical outlook remains as defensive as a cat in a dog park.
In short, bitcoin’s price action on February 6 is less about fireworks and more about fatigue. Oscillators signal weariness, moving averages lean heavily to the downside, and every time bitcoin gets up to stretch, a wall of resistance shoves it back down. It may have dodged a knockout at $60K, but unless the bulls muster more than a polite bounce, the trend isn’t going anywhere bullish. Keep your wits sharp, your charts cleaner than your kitchen, and don’t confuse a dead-cat bounce with a comeback tour.
Bull Verdict:
If bitcoin can reclaim $68,000 with volume that doesn’t look like it just rolled out of bed, bulls may have a shot at flipping the script. A confirmed close above $70,000 would mark a structural turning point, breathing life into a reversal narrative that’s currently more fairy tale than fact.
Bear Verdict:
Unless bitcoin delivers a high-volume breakout above $68,000-$70,000, rallies look more like bait than a breakout. The dominant structure remains bearish, and every bounce into resistance smells like fresh meat for trend followers riding the continuation train back toward $60,000-or lower.
FAQ ❓
- What is bitcoin’s current price?
Bitcoin is trading at $67,312 as of February 6, 2026, at 8:30 a.m. - Is bitcoin in an uptrend or downtrend?
Bitcoin remains in a broader downtrend despite a short-term rebound. - What are key bitcoin support and resistance levels?
Key support sits at $60,000; resistance is strong near $68,000-$70,000. - Are technical indicators bullish or bearish for bitcoin?
Most moving averages and momentum indicators remain bearish.
Read More
- Brent Oil Forecast
- When Binance Says “Goodbye” to MEMEFI, Chaos Ensues 🚀💸
- Is the Bitcoin Treasury ‘Bear Market’ Crisis Over? Analyst Has the Inside Scoop!
- OpenSea Snags Rally: A Token Trade Tango with a Mobile Twist 📱💰
- Cardano vs. Quantum: Charles’ ‘Clinic’ Chaos
- Gold Rate Forecast
- CNY RUB PREDICTION
- Bitcoin Miners Go Green as AI Deals and Bitcoin Surge Create Perfect Storm
- Crypto’s Latest Sugar Daddy
- How Bitcoin’s Miners Keep Their Cool (And Why That Matters!)
2026-02-06 17:42