Bitcoin, the digital diva of the financial world, is doing its best impression of a moody teenager on July 29, 2025. Hovering around $118,424—because apparently, it couldn’t decide between $117,498 and $119,026 for breakfast—it’s acting like it has all the time in the world to make up its mind. With a market cap of $2.35 trillion and a trading volume of $41.22 billion, BTC seems content to consolidate while the rest of us sit here, refreshing our screens like obsessive exes waiting for a text back.
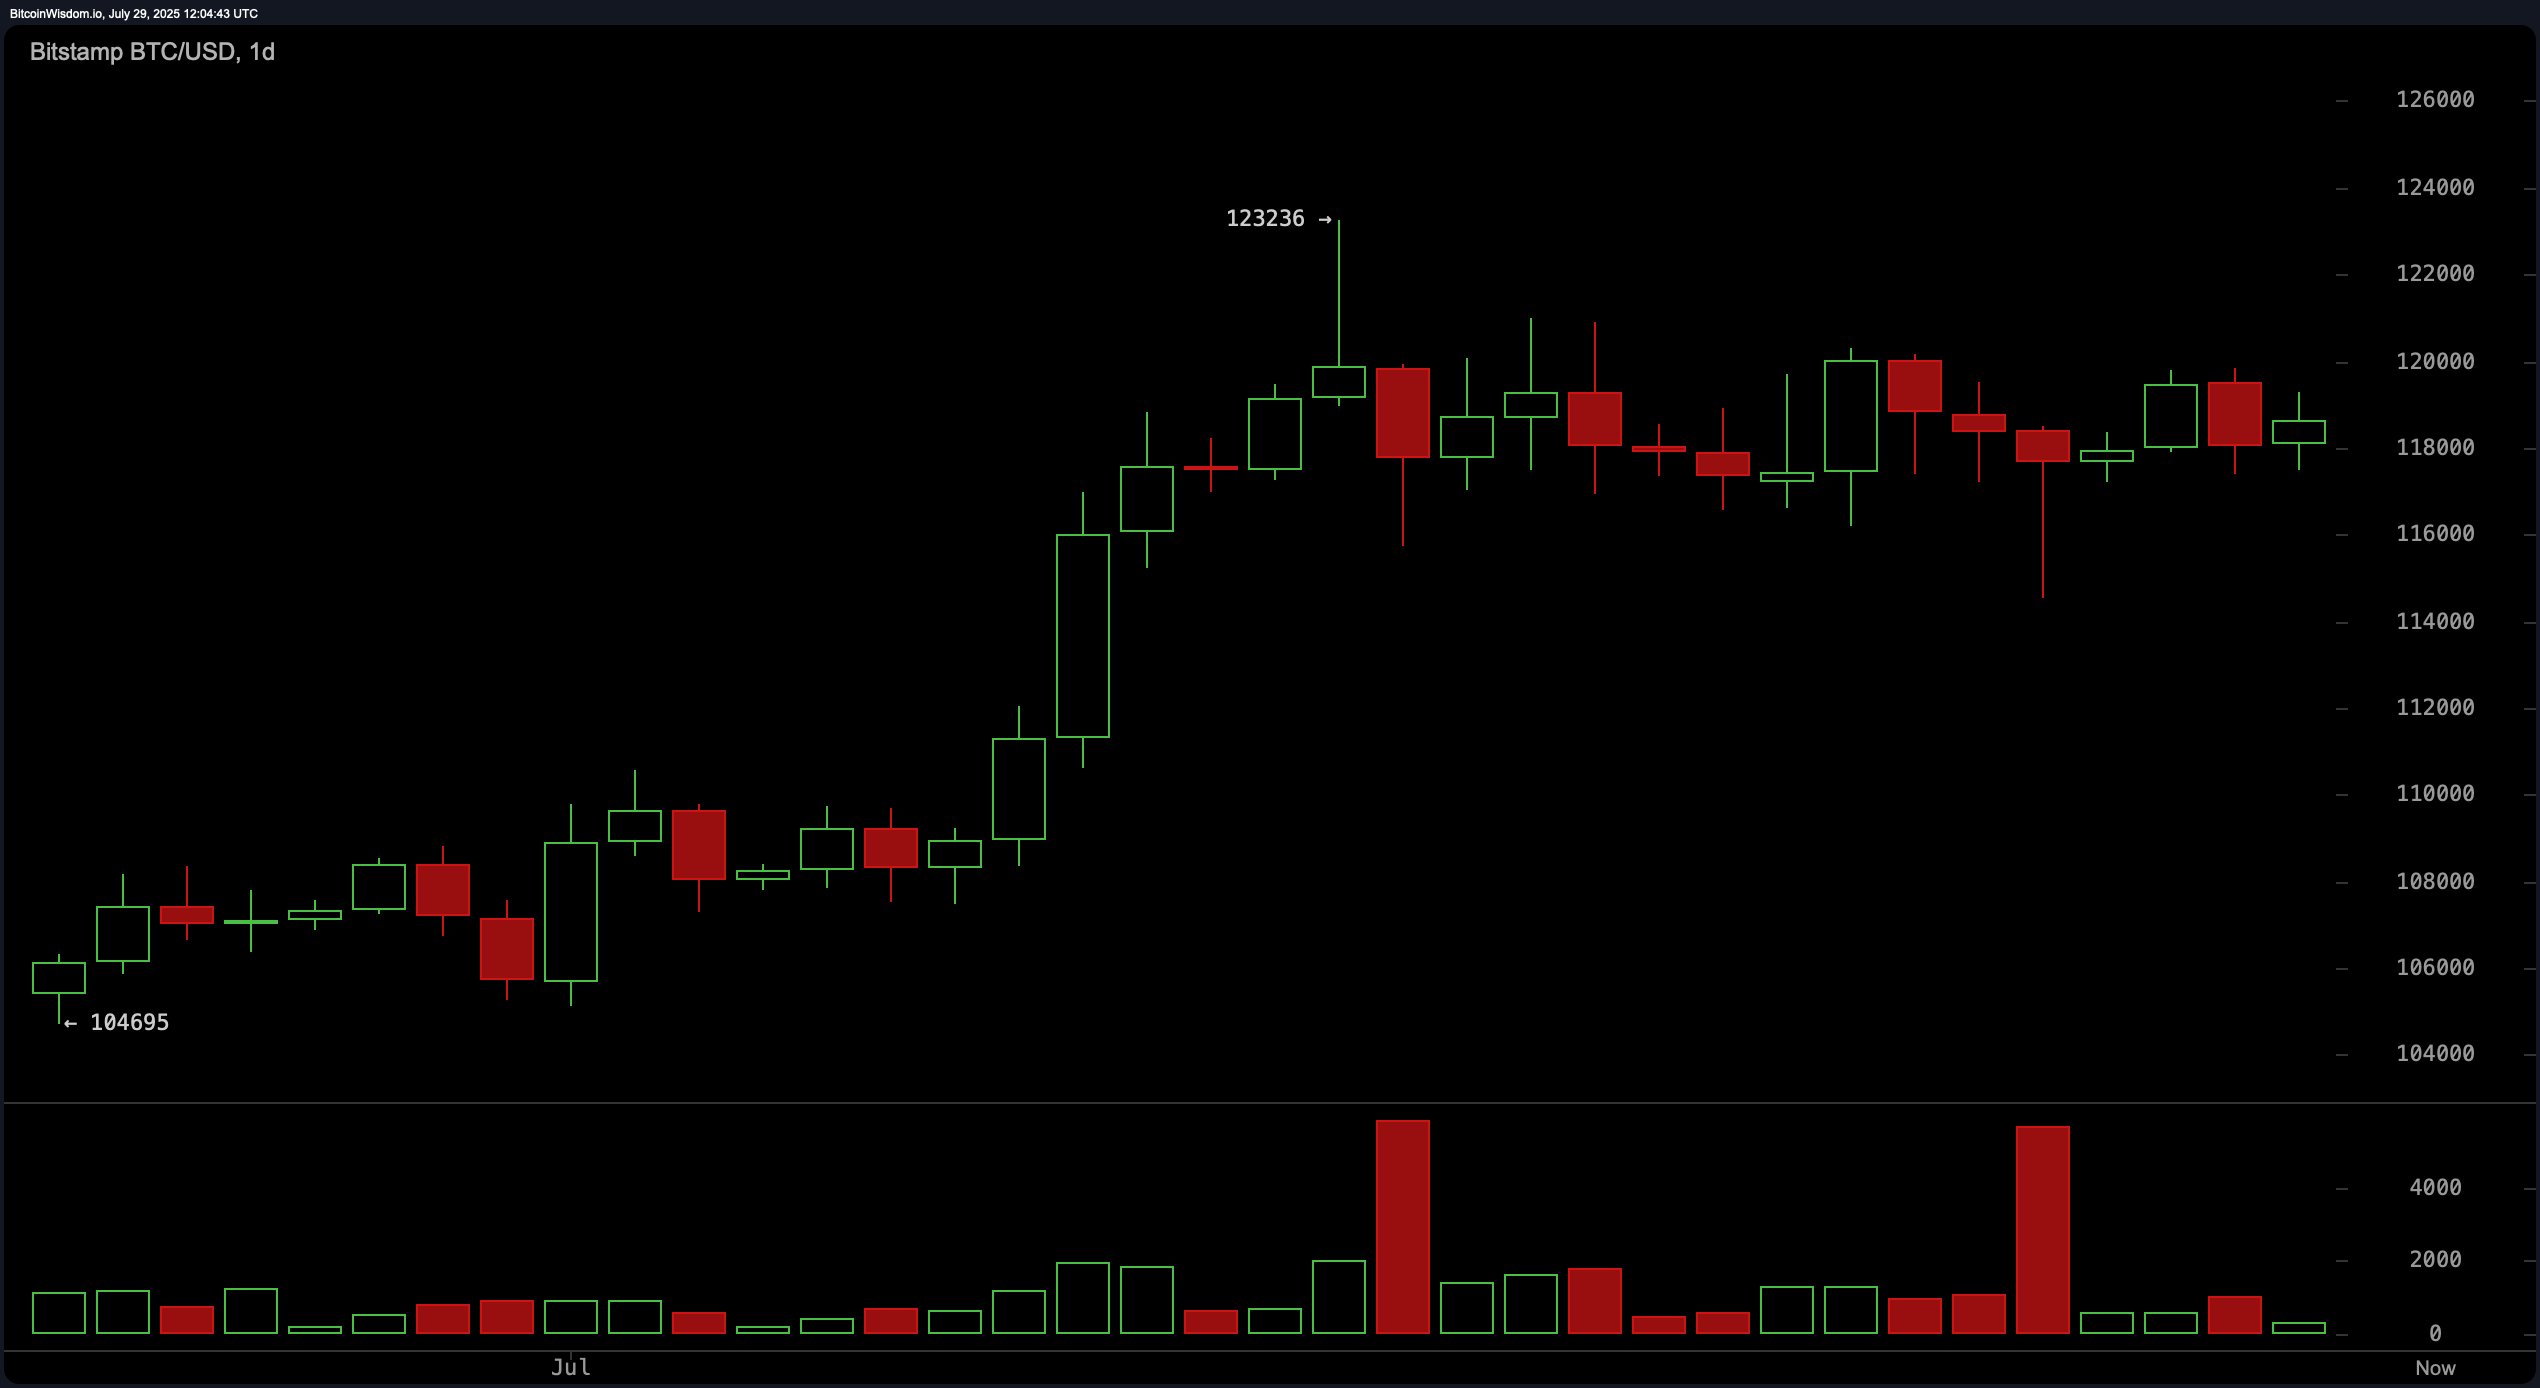
On the daily chart, bitcoin looks like it just realized it left its wallet at home after hitting that glorious peak near $123,236. Now it’s stuck between $118k and $120k, sulking as if someone stole its favorite hoodie. There was even a red volume spike after the top (classic overreaction), which might mean people are cashing out faster than you can say “crypto casino.” But hey, at least it’s still above those trendy moving averages everyone talks about—the EMAs and SMAs are basically Bitcoin’s entourage right now. If this drama queen breaks above $120,500 with some serious volume, we’re talking bullish party vibes. Drop below $116k? Cue the sad trombone. 🎺
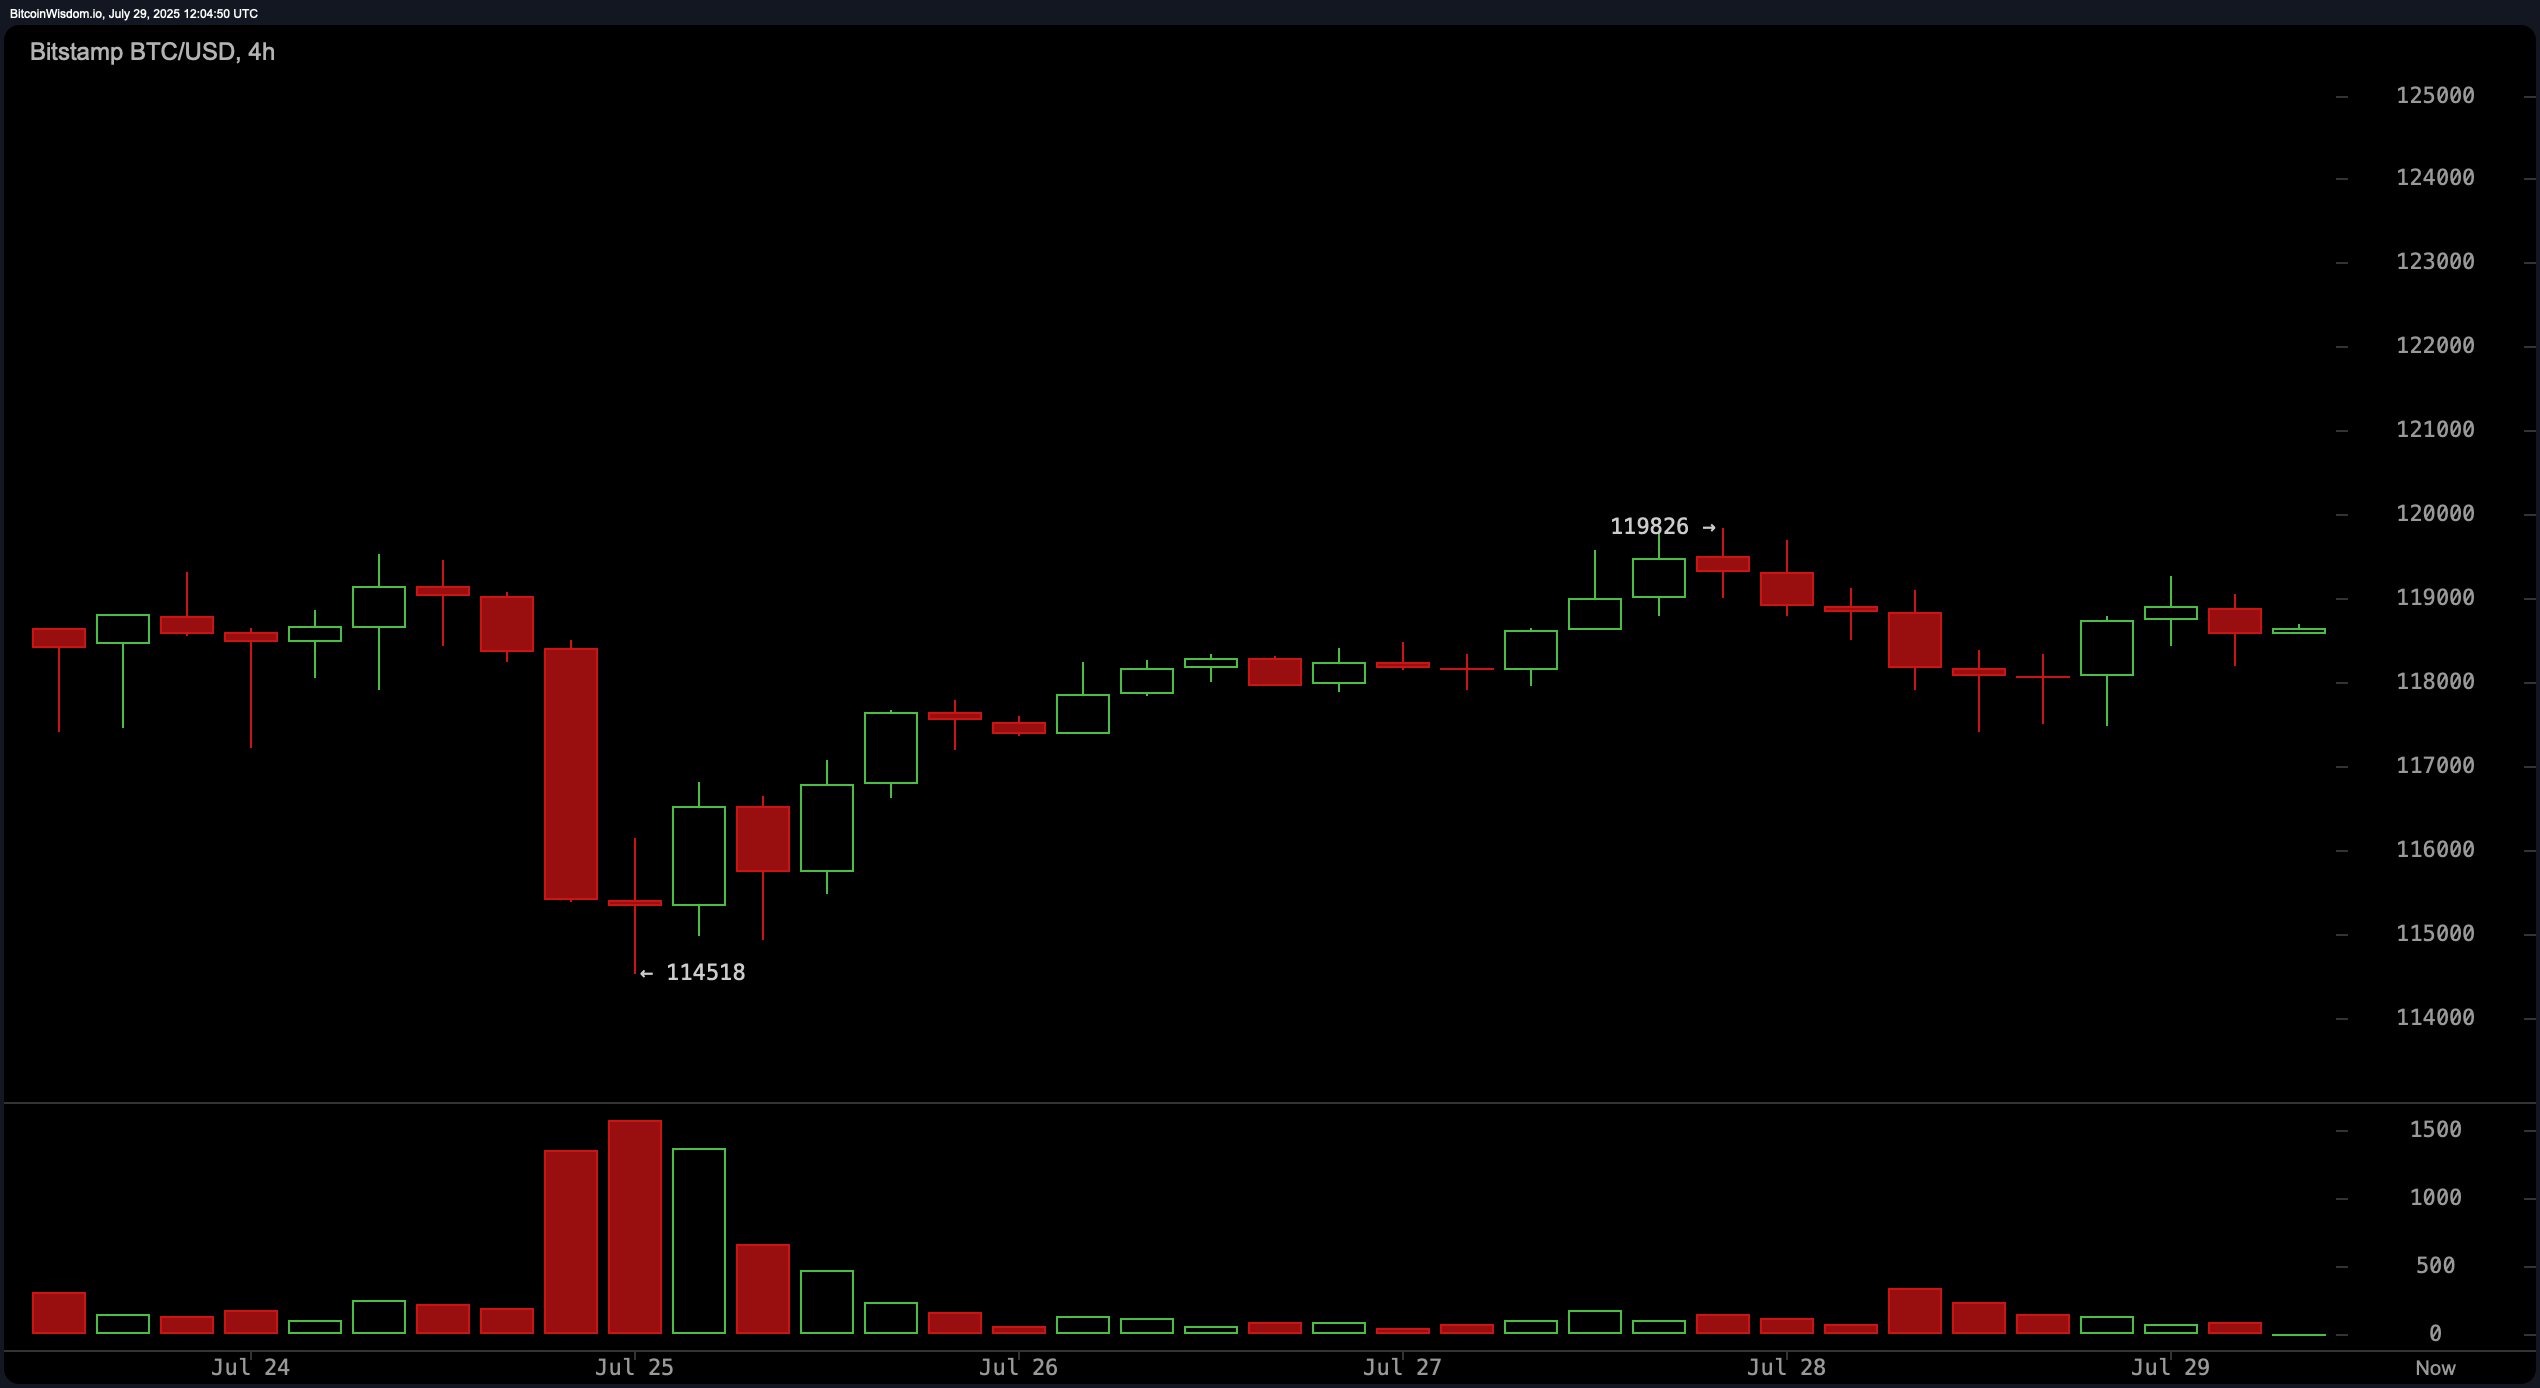
Zooming into the 4-hour chart, BTC/USD pulled off a V-shaped recovery from $114,500 like it was rehearsing for a magic show. Unfortunately, no one clapped because the volume was weaker than my enthusiasm for Monday mornings. This little rebound feels more like a fluke than a feature film sequel unless it smashes through $119,826 resistance. If it closes above $120k with rising volume, cue fireworks. Otherwise, prepare for a nosedive toward $114,500—or worse, emotional bankruptcy. 😭
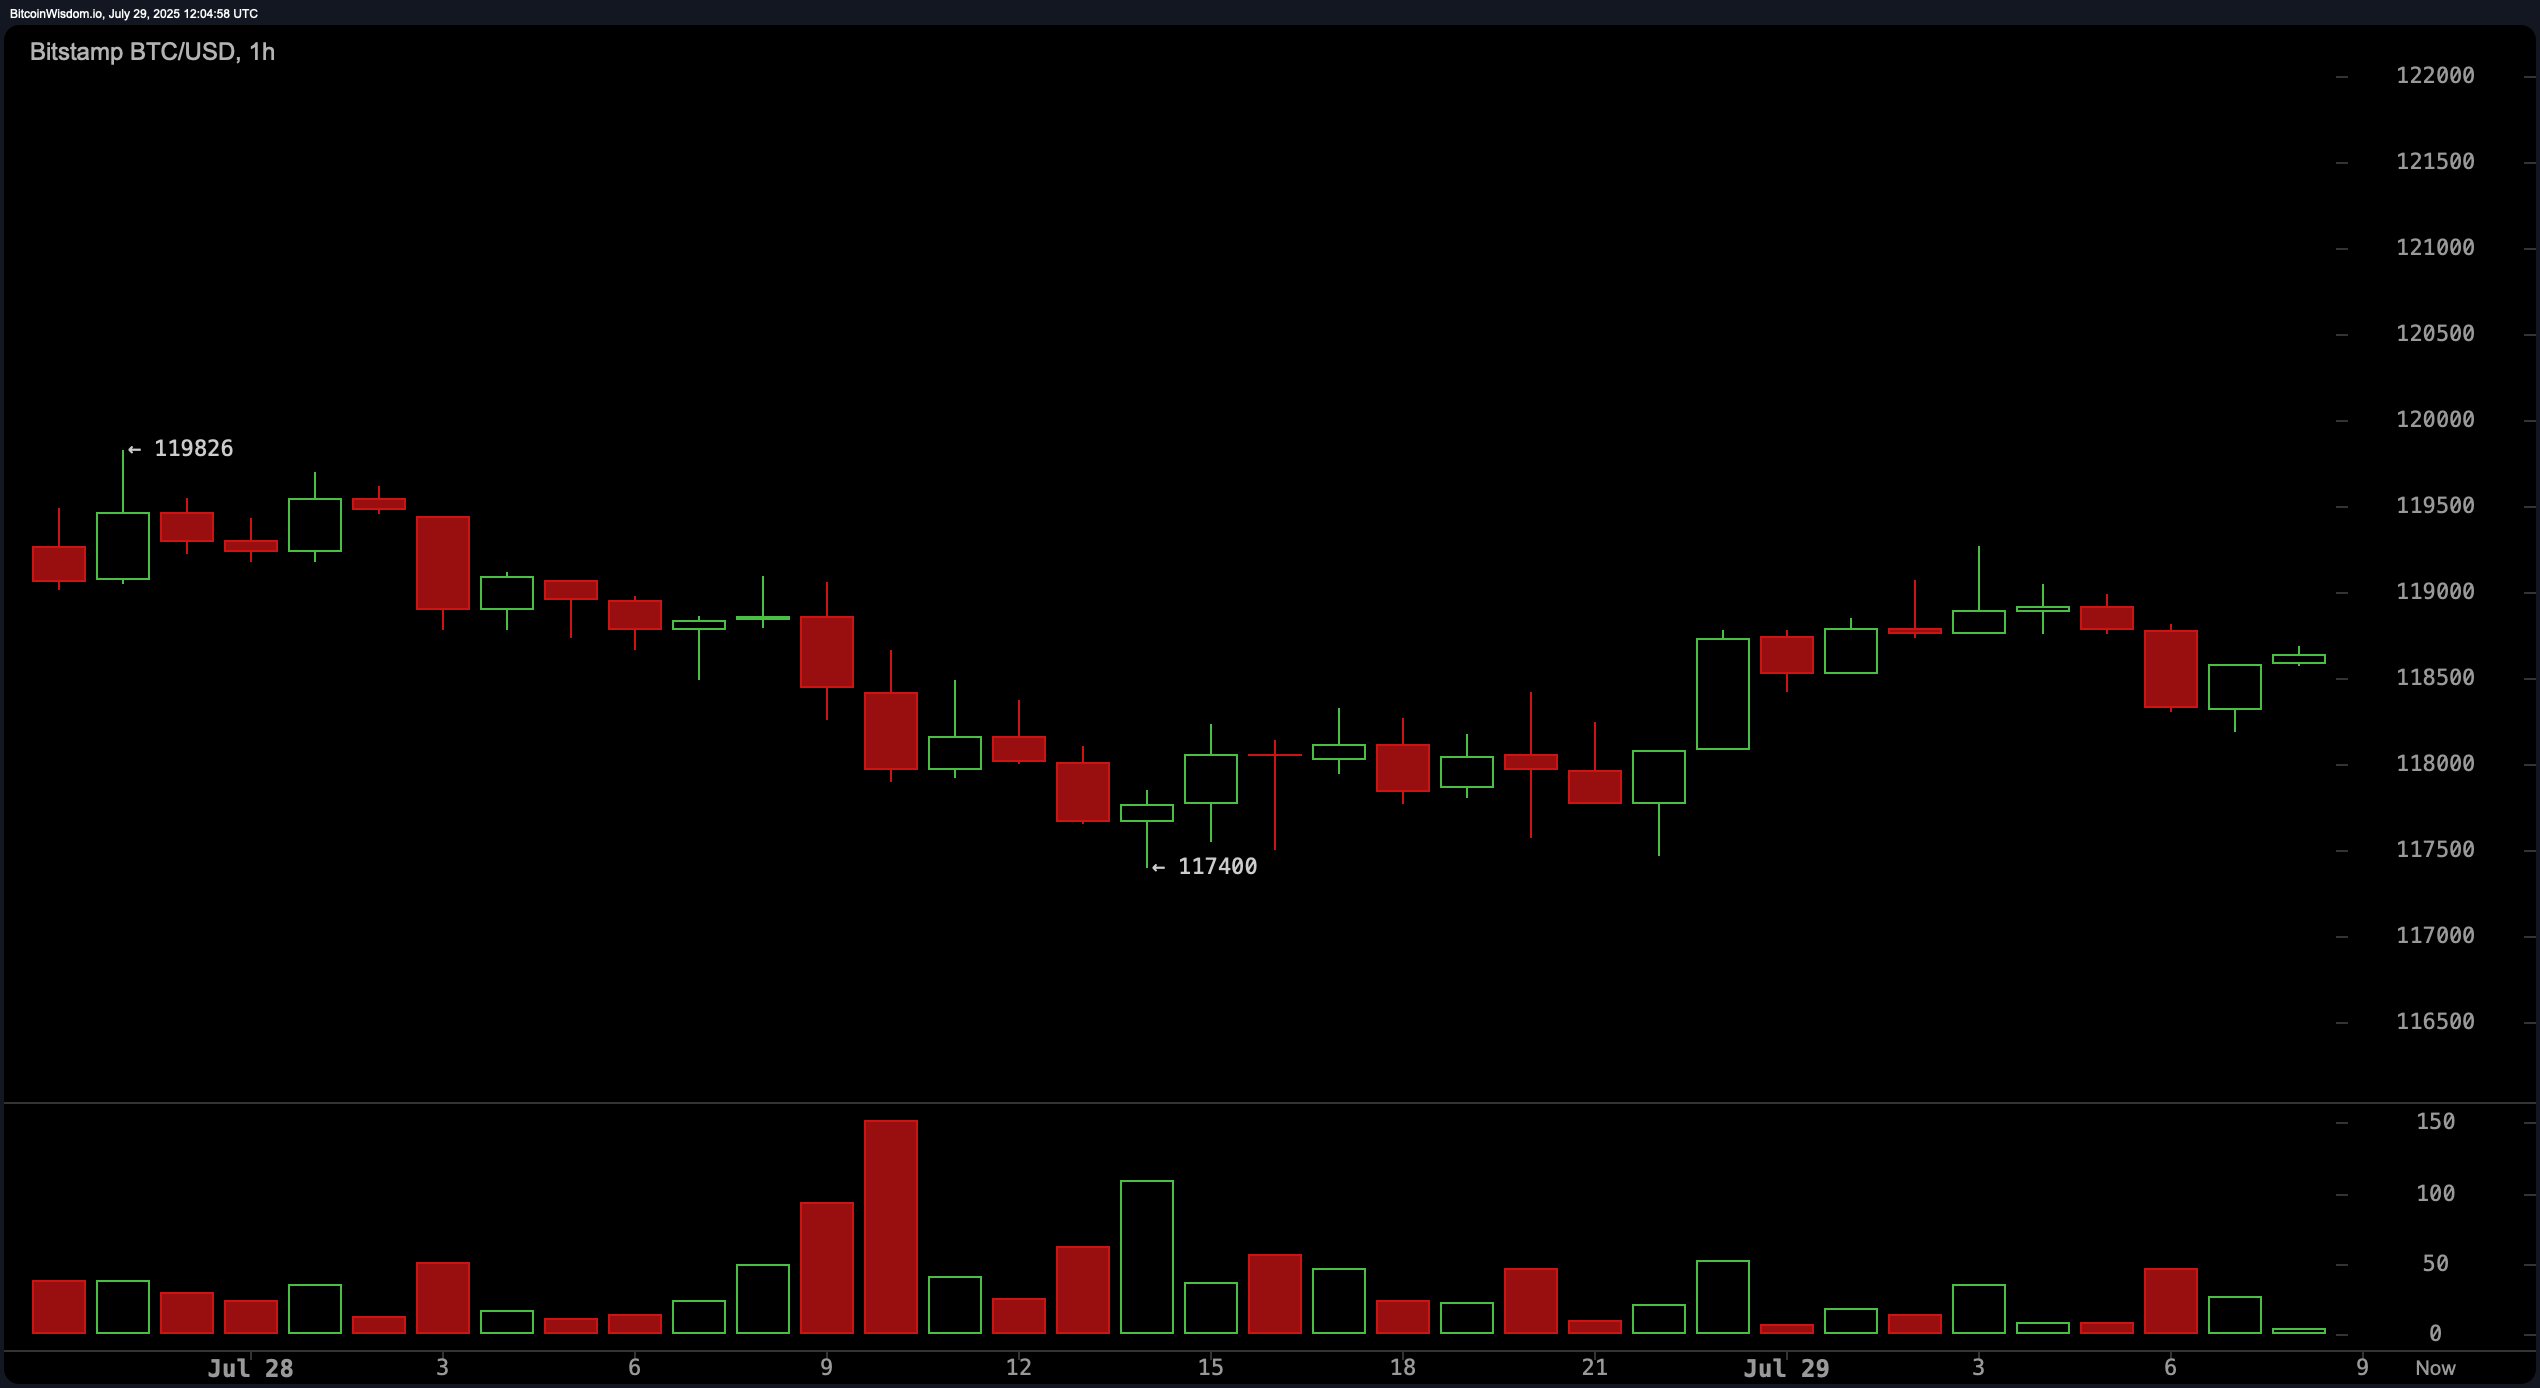
The 1-hour chart is where things get truly chaotic. Imagine a toddler playing with crayons—that’s what this pattern looks like. Lower highs and lows followed by a half-hearted recovery near $117,400 scream “I’m trying, okay?” A close above $118,800 could spark short-term excitement, but rejection near $119,200 or a breakdown under $117,500 will have bears sharpening their claws. 🐻
Oscillator readings? Oh, they’re as neutral as Switzerland during wartime. The RSI sits lazily at 60, the stochastic %K yawns at 58, and the CCI shrugs at 26. Even the ADX is chilling at 25, whispering, “Meh.” Meanwhile, the awesome oscillator clocks in at 4,041—still neutral—and the MACD gives a subtle bearish wink at 2,066. Clearly, these indicators are having an existential crisis alongside Bitcoin itself.
But wait! Moving averages come to the rescue, flashing bullish signals like neon signs in Vegas. All major EMAs and SMAs—from 10 to 200 periods—are shouting, “Go long!” Well, not literally shouting, but you get the idea. As long as Bitcoin doesn’t trip over its own feet and stays above key levels, there’s hope for another run at $123k or higher. Optimism lives!
Bull Verdict:
If Bitcoin finally grows a backbone and punches through $120,500 resistance with conviction, buckle up for liftoff. Bulls will parade around like they invented gravity, and prices could retest $123k faster than you can regret selling too early. 🚀
Bear Verdict:
However, if Bitcoin trips and falls below $117,500 (or worse, $116k), brace yourself for a full-blown meltdown. Bears will be celebrating like it’s New Year’s Eve, dragging prices toward $114,500 or lower. Momentum is fading, and let’s face it—Bitcoin’s confidence is shakier than mine after three cups of coffee. ☕📉
Read More
- Brent Oil Forecast
- CNY RUB PREDICTION
- 🚀 Crypto ETF Hits Wall Street: Your Wallet’s New BFF! 🤑
- JPMorgan Boosts Core Scientific’s AI Push with $500M, Total Financing Hits $1B
- Silver Rate Forecast
- SUI PREDICTION. SUI cryptocurrency
- Norway’s Wealth Fund Meets Bitcoin: A Most Surprising Union 💸
- Crypto Execs & Senators: A Dance of Diplomacy and DeFi Drama
- ETH’s Descent: Will $2.5K Become Its New Country Club? 🐻📉 #CryptoDrama
- Bitcoin’s Wild Ride: From $110K to $108K in a Blink
2025-07-29 15:59