Oh, behold the majestic battle of Bitcoin! Trading feverishly between $113,561 and $113,800, with a market cap standing at a jaw-dropping $2.26 trillion. In the last 24 hours, it witnessed a trading volume of $49.17 billion, a range from $112,680 to $115,899, and uncertainty spreading like wildfire. Volatility is the word, my friends! 🔥
Bitcoin
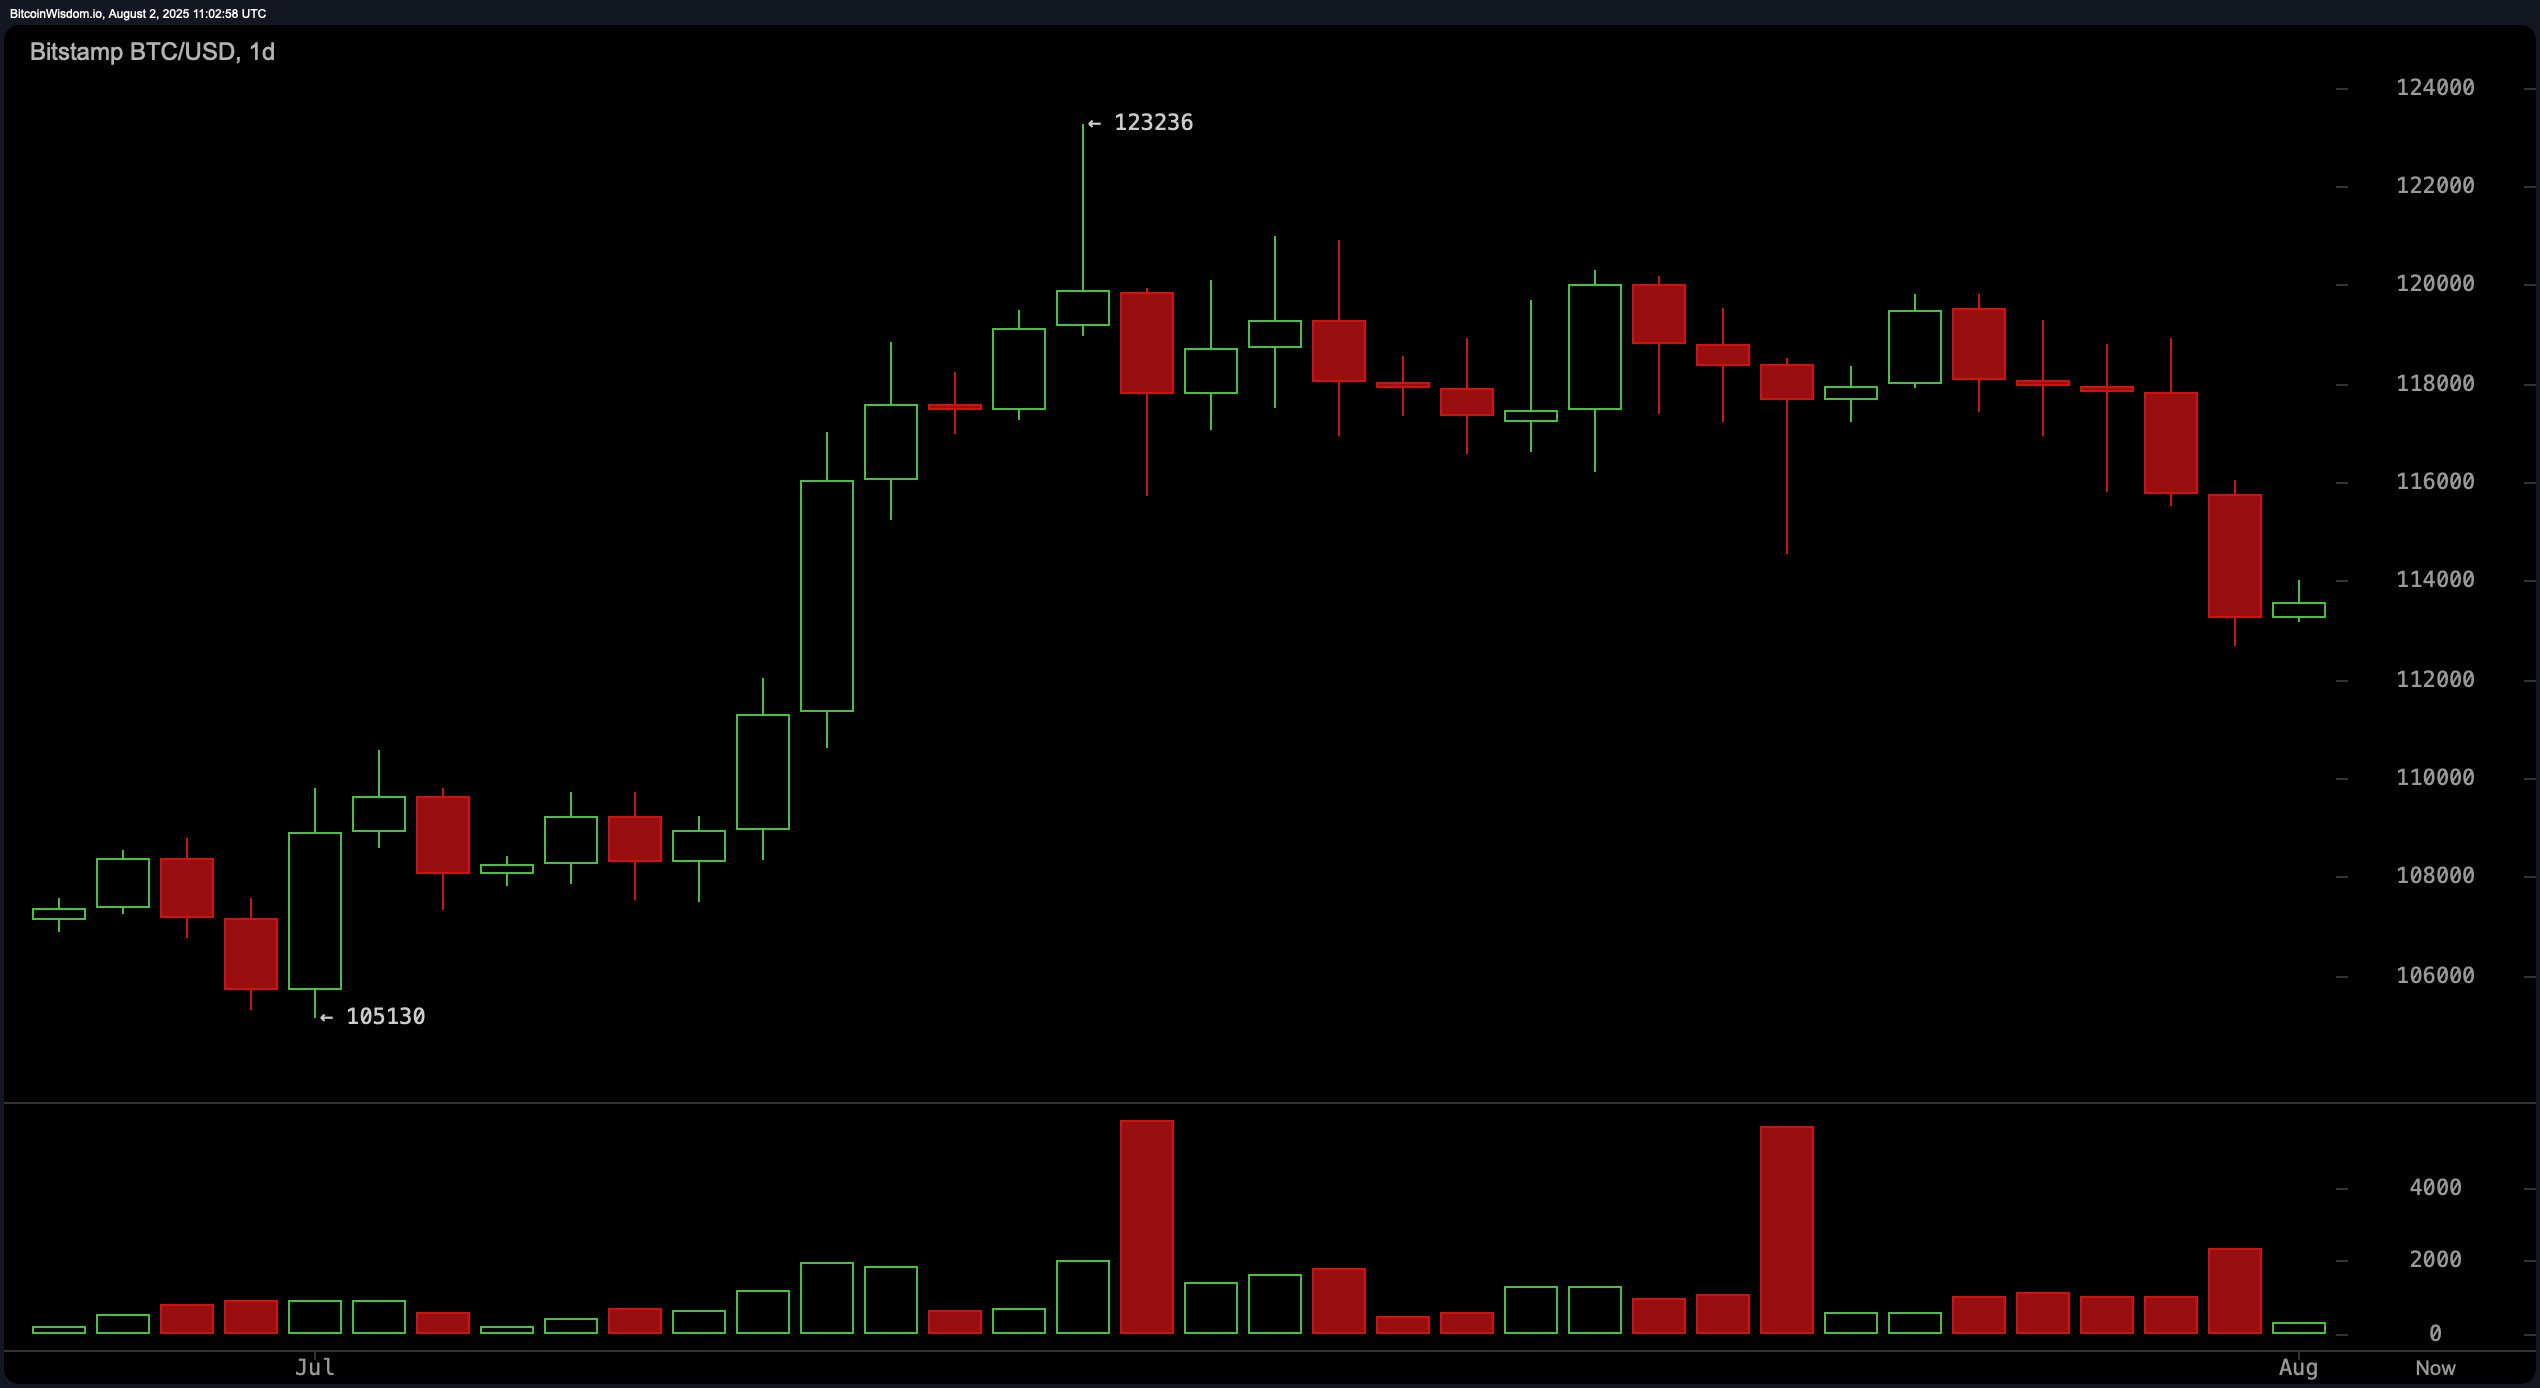
A glance at the daily chart shows our beloved Bitcoin taking a little tumble from its former glory of $123,236, which clearly indicates a short-term downtrend (oh, how the mighty fall!). There’s a wave of selling near the top, confirming we’re in a distribution phase, with resistance stuck between $118,000 and $120,000. But wait! The $112,680 to $113,000 range seems to offer some hope as it’s been a consistent support level. Perhaps this is where the bulls can regroup? But—if the price stays below $117,000 and keeps sinking, it might be time for the bears to pop the champagne. 🐻🍾
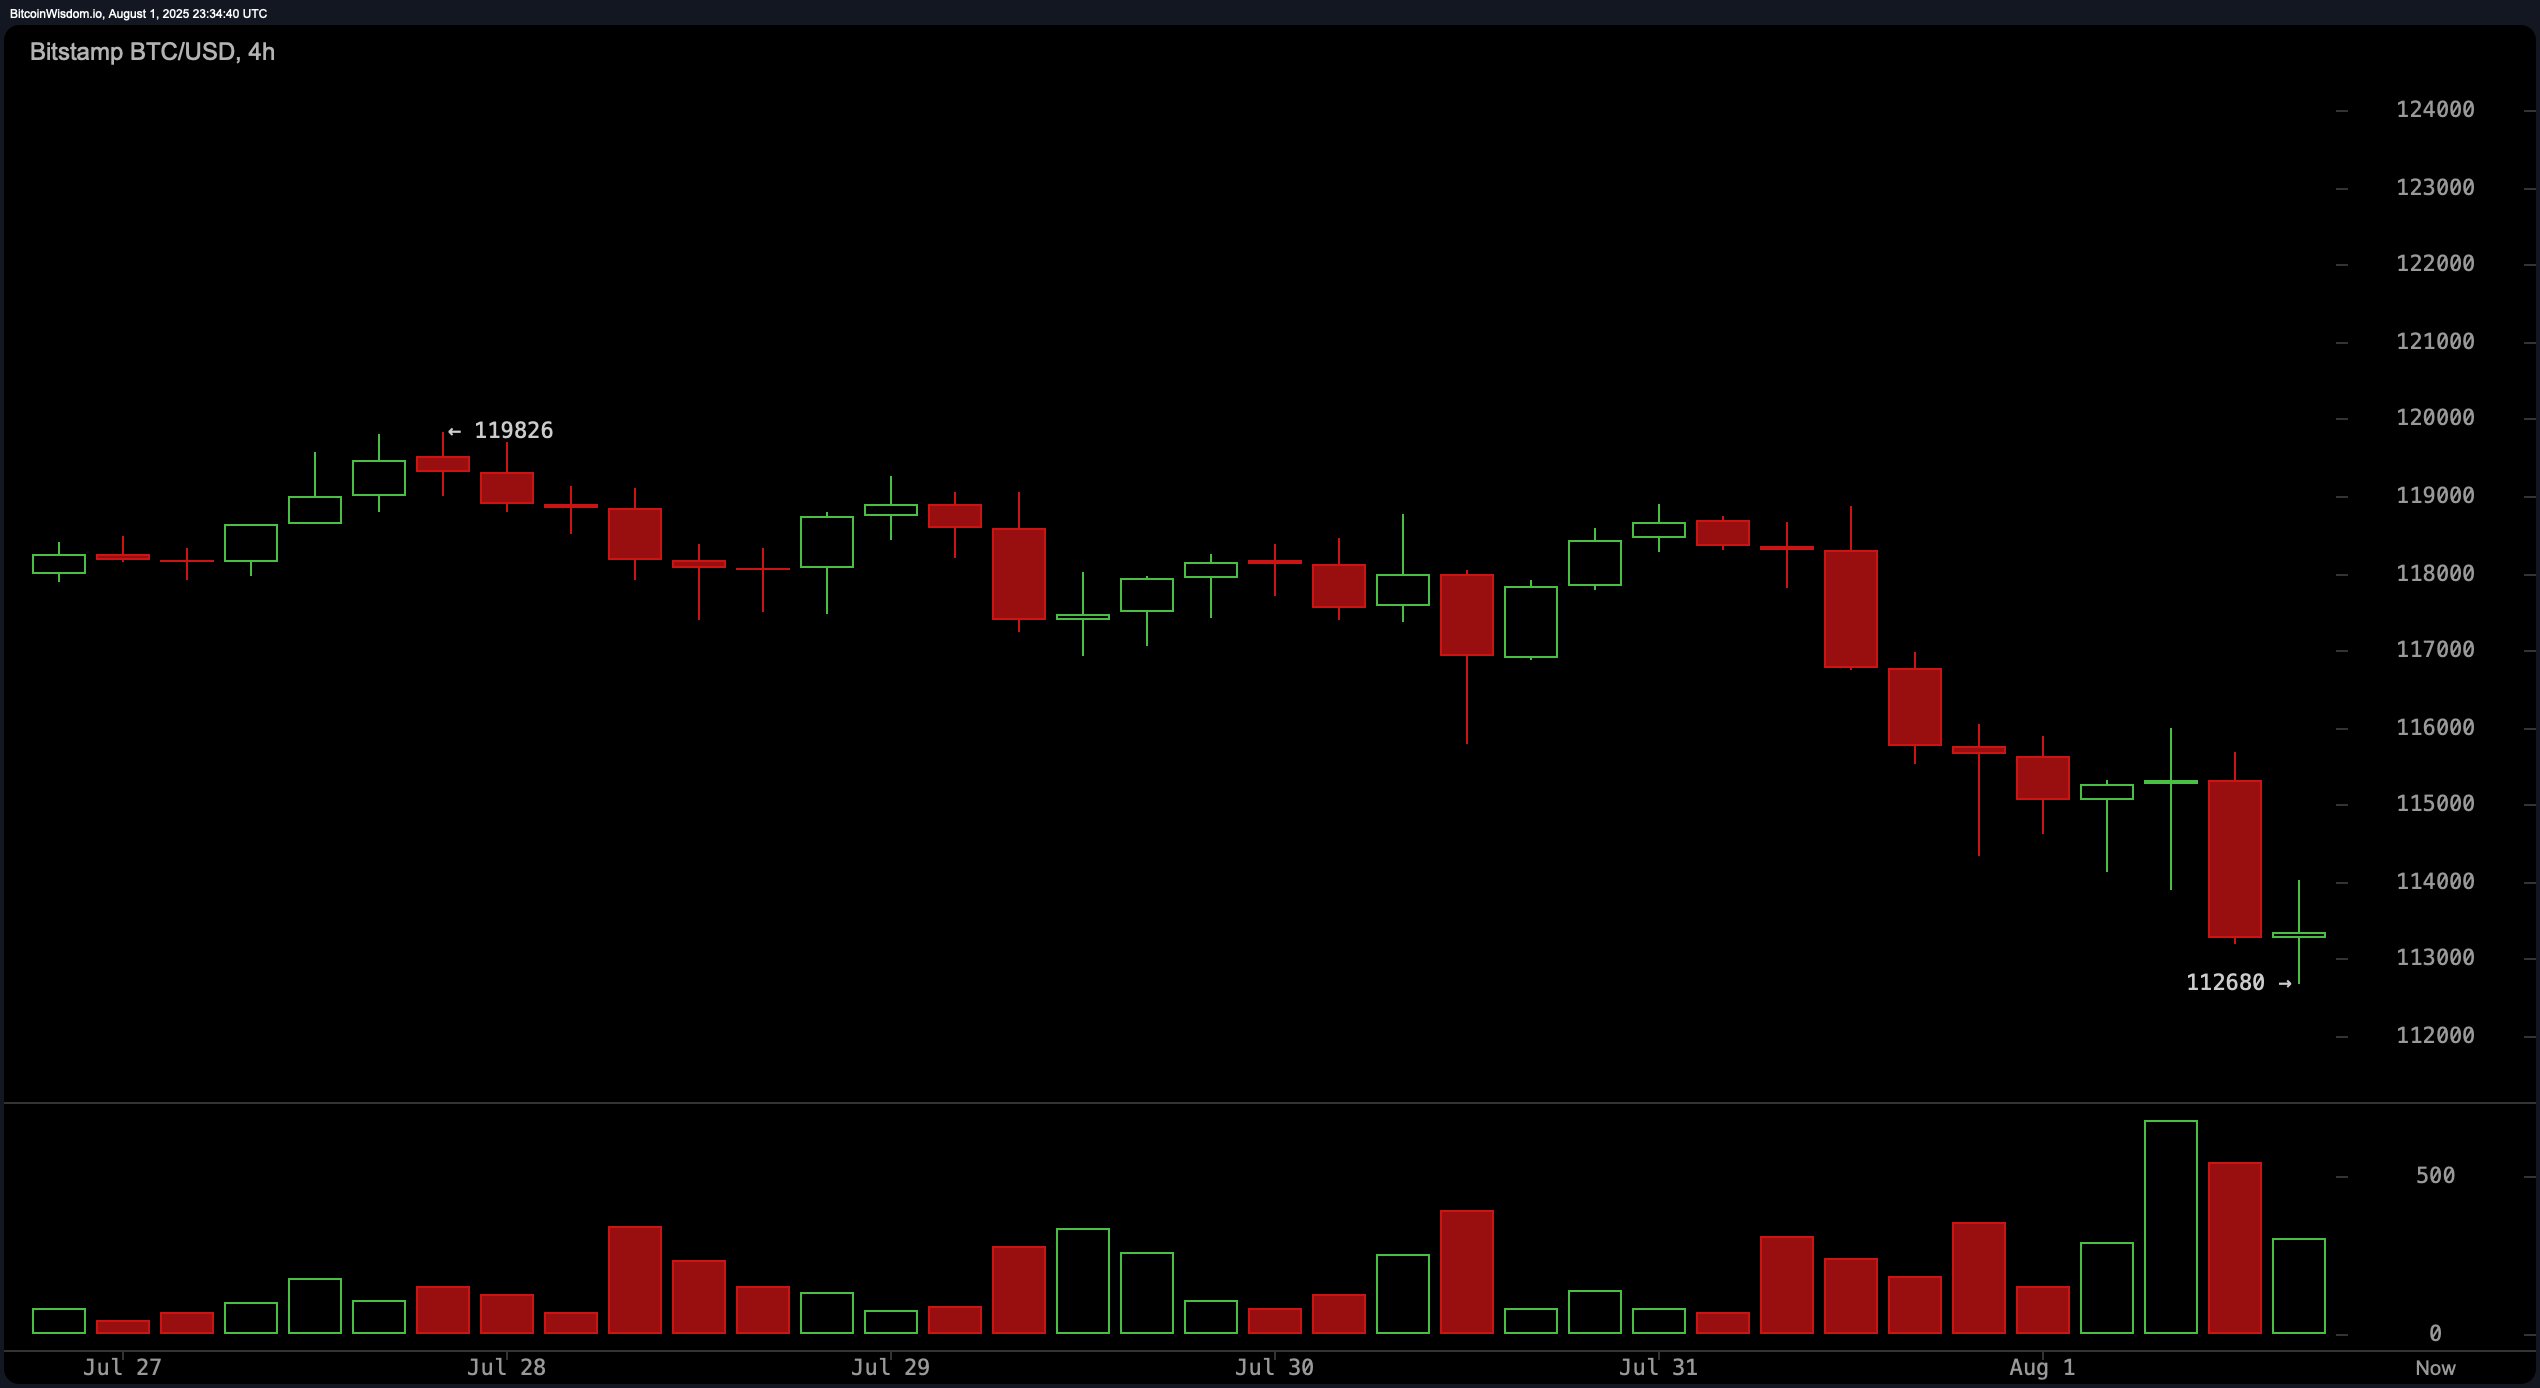
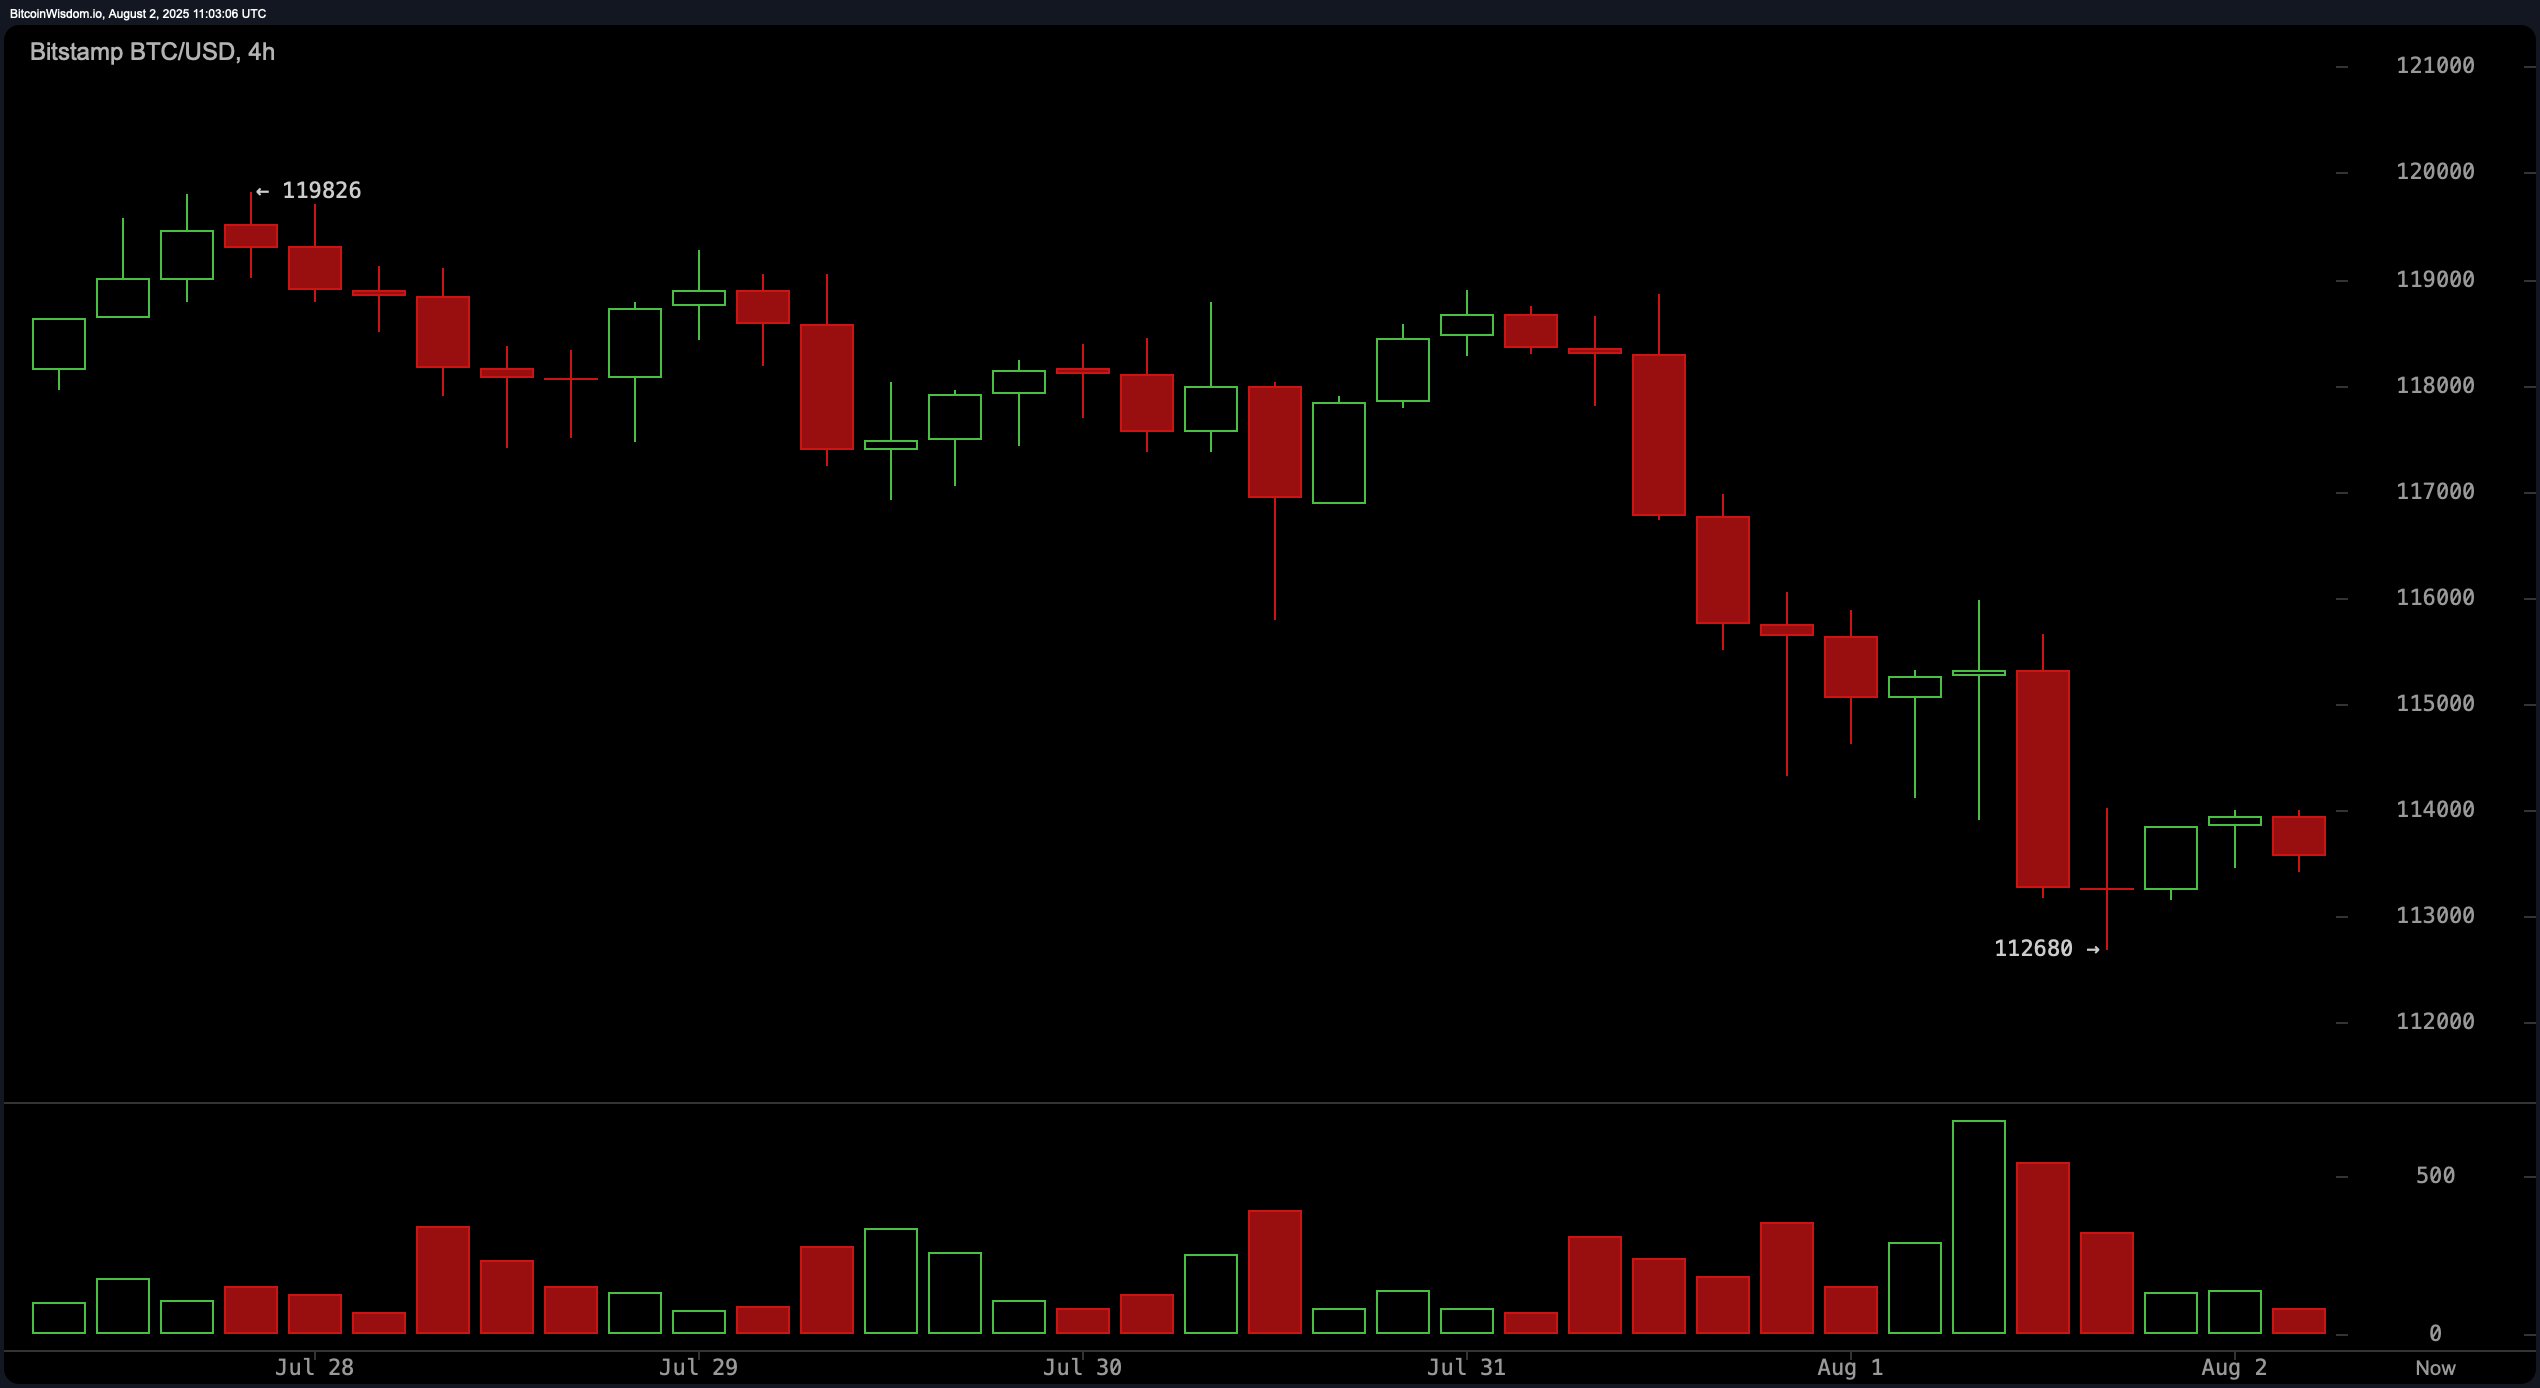
Now, on the 4-hour chart, Bitcoin is giving off serious bearish vibes. Those bearish engulfing candles? Yeah, they’re not exactly a sign of party time. The price’s flirtation with the $112,680 support is like that awkward date nobody wants to remember. Attempts at recovery? Weak! Low-volume green candles that barely made a dent. Right now, it looks like Bitcoin is stuck in a potential consolidation zone between $112,500 and $114,500. If it breaks out and gathers volume, a short squeeze could send us to $116,000. But if it dips below $112,500? Prepare for another downward spiral. 😬
The 1-hour BTC/USD chart tells an even darker story. Lower highs, lower lows—an unmistakable bearish trend. Sure, there was a tiny bounce from $112,680, but don’t get your hopes up. The volume is underwhelming, and the candlestick patterns have zero enthusiasm. Immediate resistance sits between $114,200 and $114,500. If Bitcoin bursts through this, there could be a tiny bullish blip, but fail to hold above $113,000, and it’s back to the downside. Yikes! 🥶
When it comes to oscillators, the signals are all over the place. The RSI is sitting at 43—neutral, not exactly giving us a warm hug. The Stochastic’s at 13, also unbothered. But hold on, the CCI’s at -265, and momentum’s at -5,256, which might suggest a flicker of hope for the bulls. However, the MACD at 730 is waving a giant red flag with a strong bearish signal. The ADX at 21 screams “meh” as it points to a weak trend. Basically, the market can’t decide which way to go—flip a coin if you must! 🪙
As for moving averages, they’re a bit of a mixed bag. The short-term EMAs and SMAs are all below the current price, giving us bearish signals. But long-term averages? They’re suggesting there’s still some hope for the bulls. The long-term investor’s dream is still alive, while the short-term traders are panicking and fleeing for the hills. The smart move? Keep an eye on those support and resistance thresholds for the next big move. 🔍
Bull Verdict:
If Bitcoin can hold the support above $112,500 and the selling pressure fades into oblivion, a bullish reversal toward $116,000 is possible. But be warned, without some volume action, the bulls could quickly lose their steam. 🤞
Bear Verdict:
If Bitcoin can’t hold $112,500 and faces more resistance near $114,500, then the bears will take the wheel. A move down to $110,000 seems all too likely, and the weak buying interest suggests the bears are in full control for now. 🐻
Read More
- Gold Rate Forecast
- USD CNY PREDICTION
- Silver Rate Forecast
- Norway’s Wealth Fund Meets Bitcoin: A Most Surprising Union 💸
- Ripple’s $1B Gamble: XRP’s New Empire or a Crypto Catastrophe? 🚀💸
- Bostic Bails Out? Trump’s Fed Takeover Nears!
- Pi Network’s Node Update: A Techy’s Dream or a Developer’s Nightmare? 🤯
- Bitcoin’s Boom Turned Bust? Risk Managers Sound the Alarm!
- MegaETH’s Frontier Beta: Will It Crash or Crush It? 🚀💥
- GBP RUB PREDICTION
2025-08-02 15:50