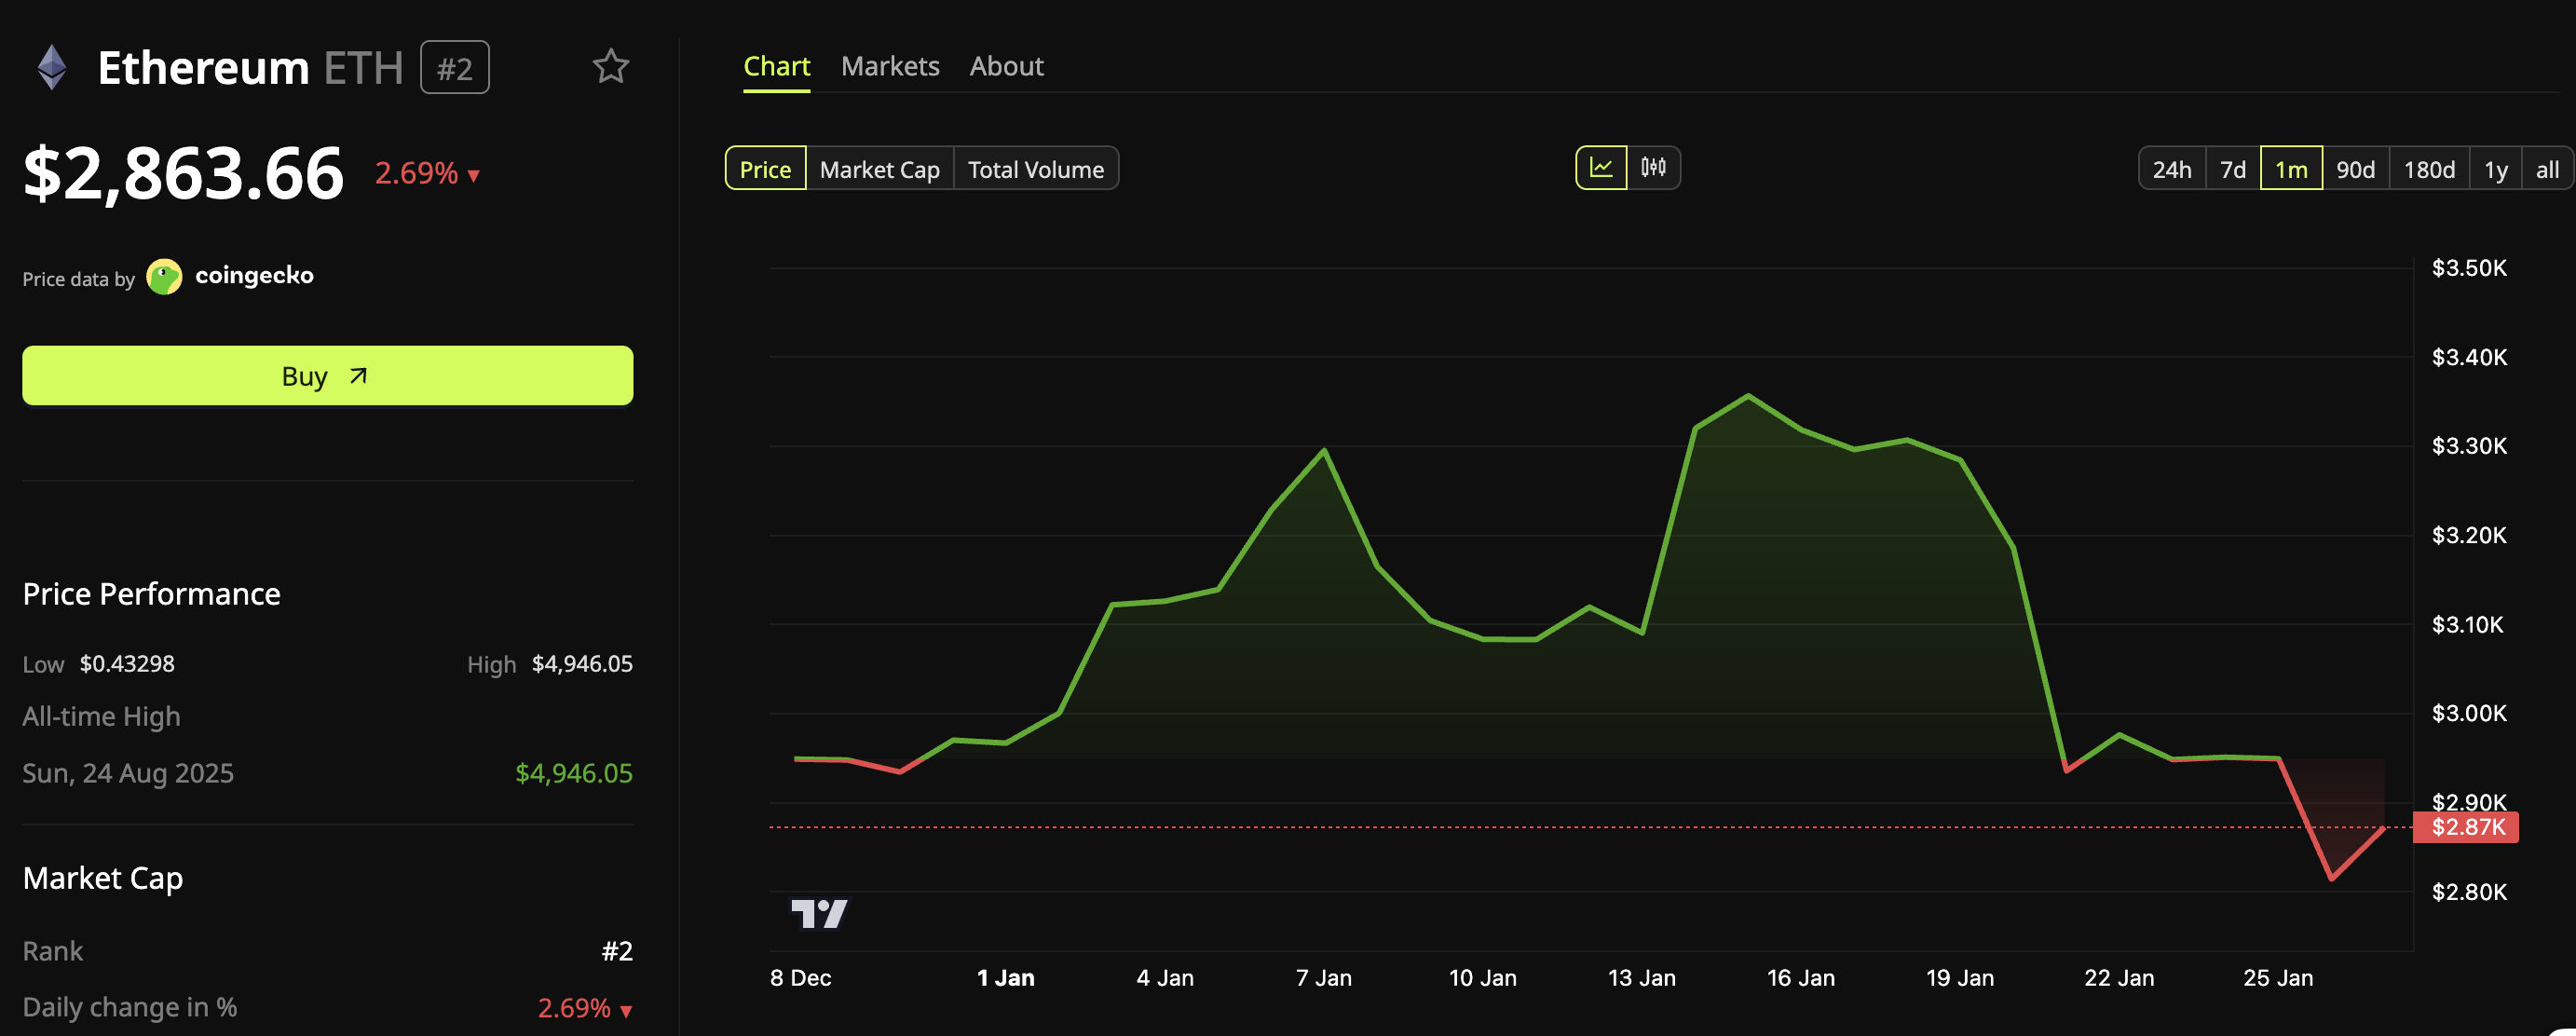
Ethereum Whale Wakes Up, Sniffs Coffee, Dumps $145M on Gemini
So, this Ethereum whale, who’s been napping harder than I do during a Seinfeld rerun, finally decides to wake up after nine years. What’s the first thing this genius does? Moves 50,000 ETH-yeah, that’s $145 million in human money-to Gemini. Why? Who knows? Maybe the guy just realized he’s been sitting on a digital goldmine … Read more