Is Solana Heading for a Dramatic Plunge? Discover the Shocking Truth!
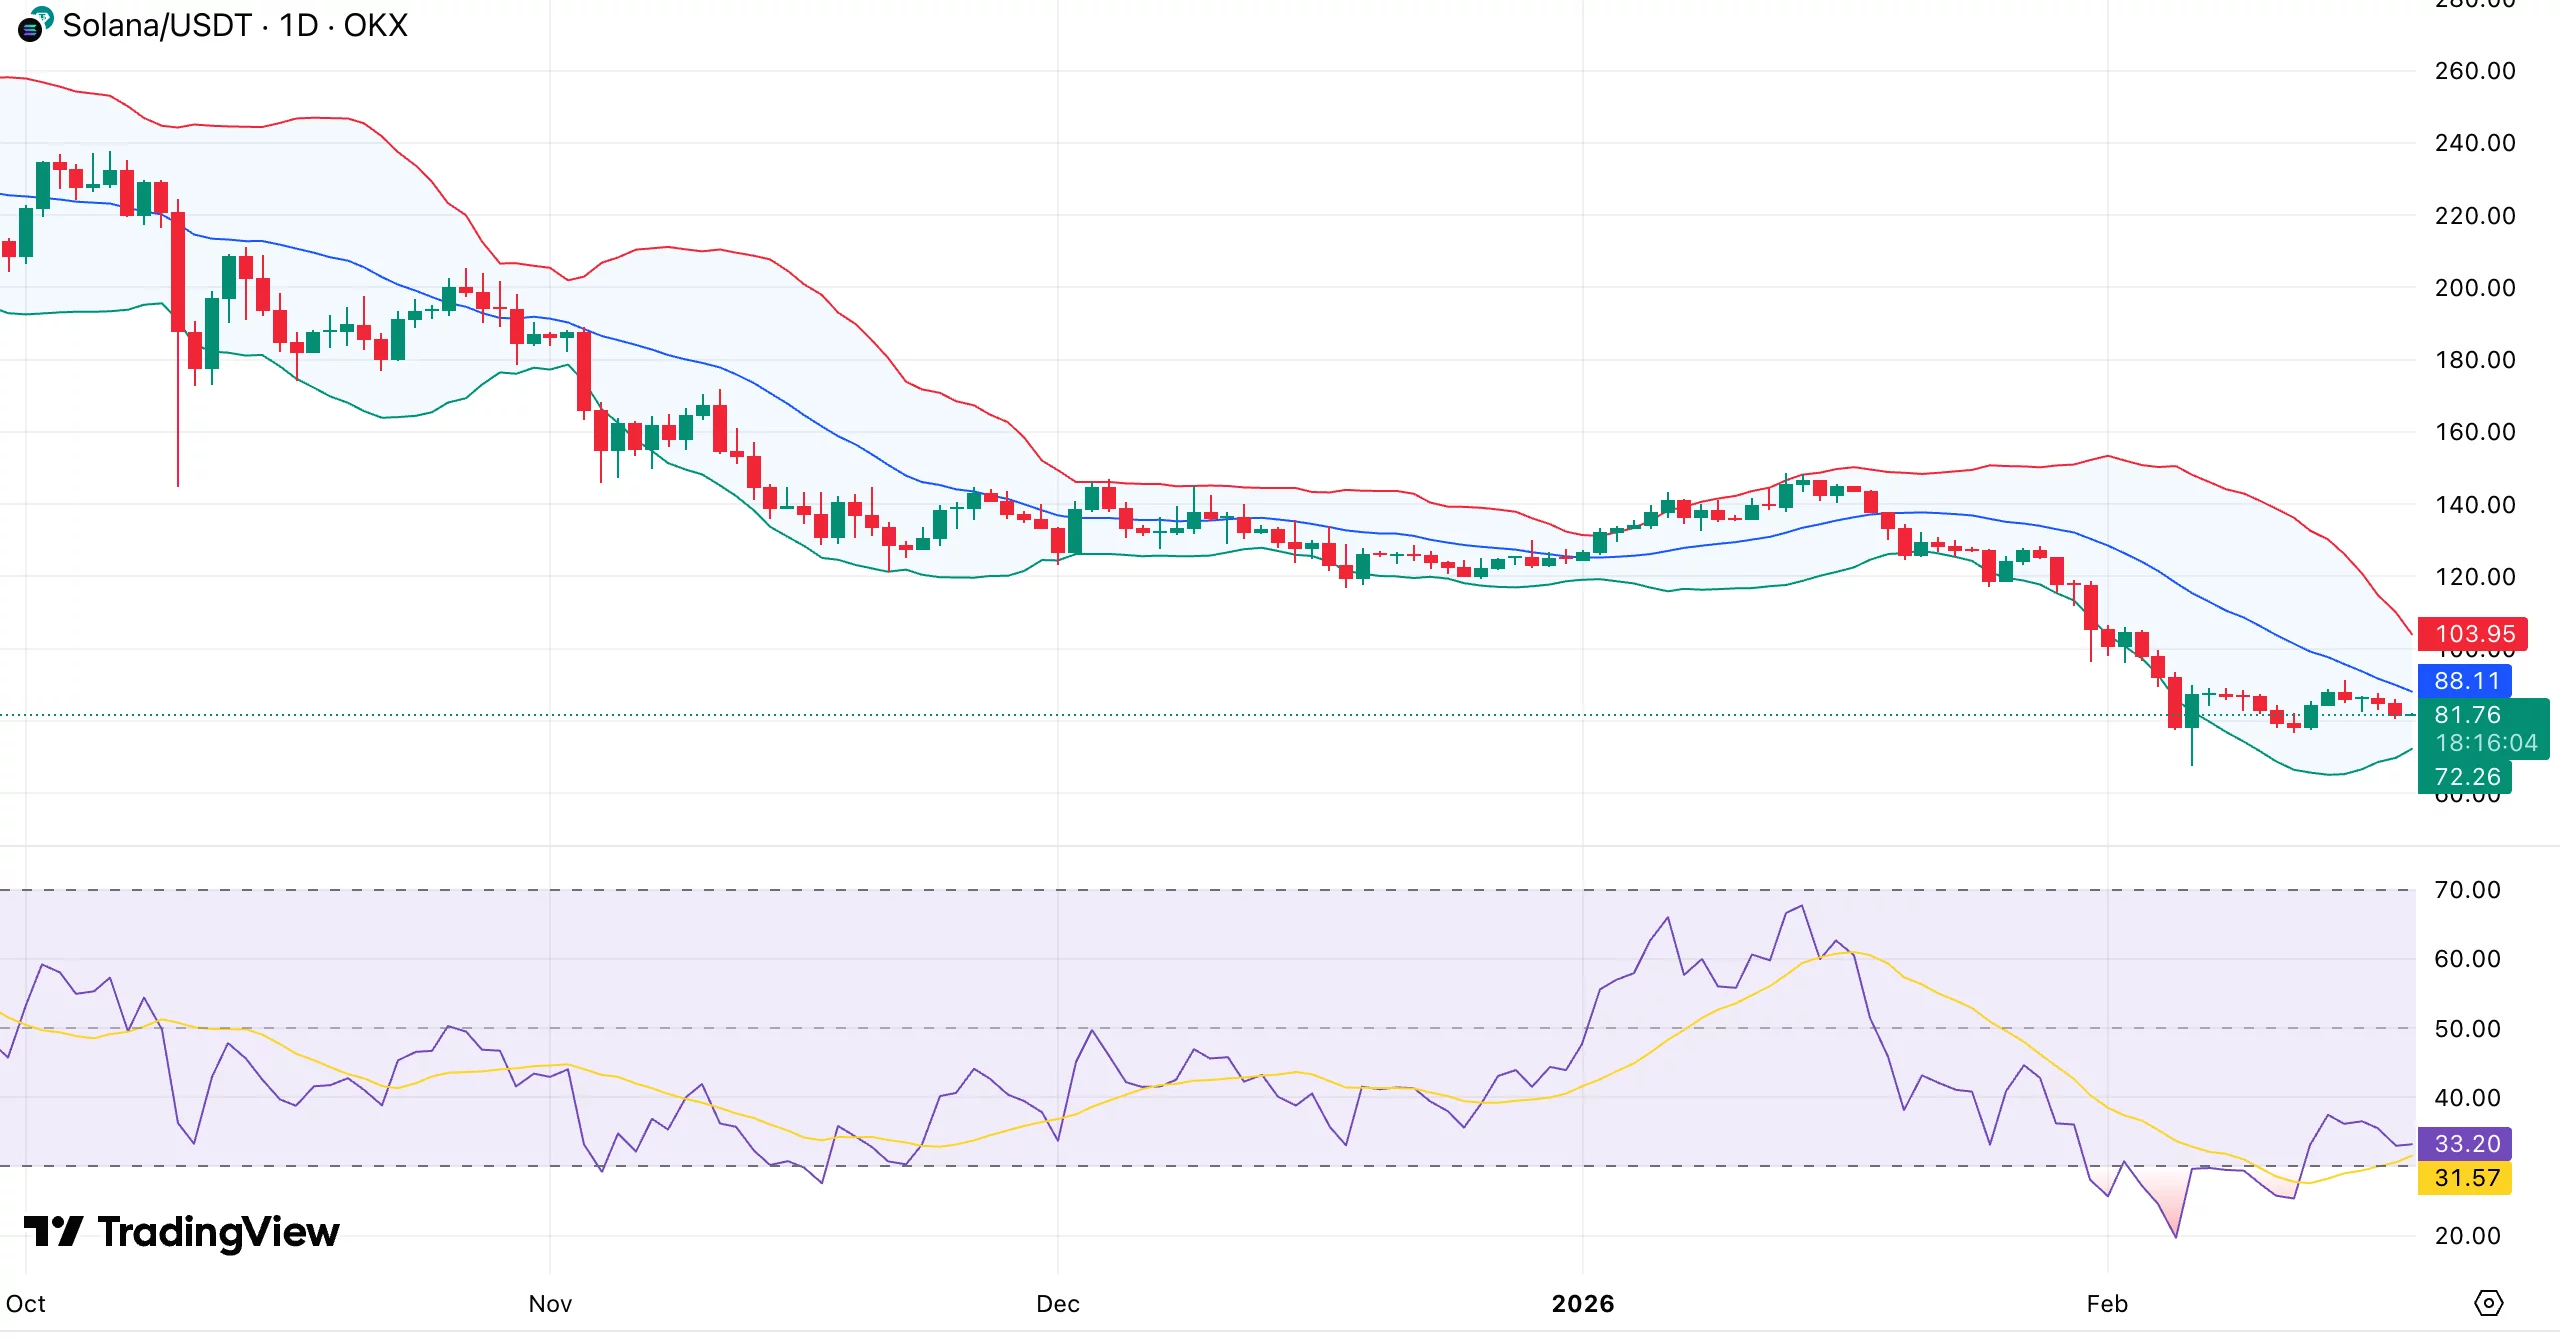
As of our latest report, Solana trades at $81.67, having succumbed to a 3.7% decline in the past 24 hours. Over the past week, it has danced between $76.81 and $90.59, but alas, it finds itself languishing near the lower end of this uninspiring range.