On March 5, 2026, Bitcoin was trading around $72,648. After a brief price increase overnight, trading stabilized between a support level of $72,600 and a resistance level of $73,100. Analysis of short-term and longer-term price charts suggests the market is currently in a neutral position, with no strong upward or downward trend.
Bitcoin Chart Outlook
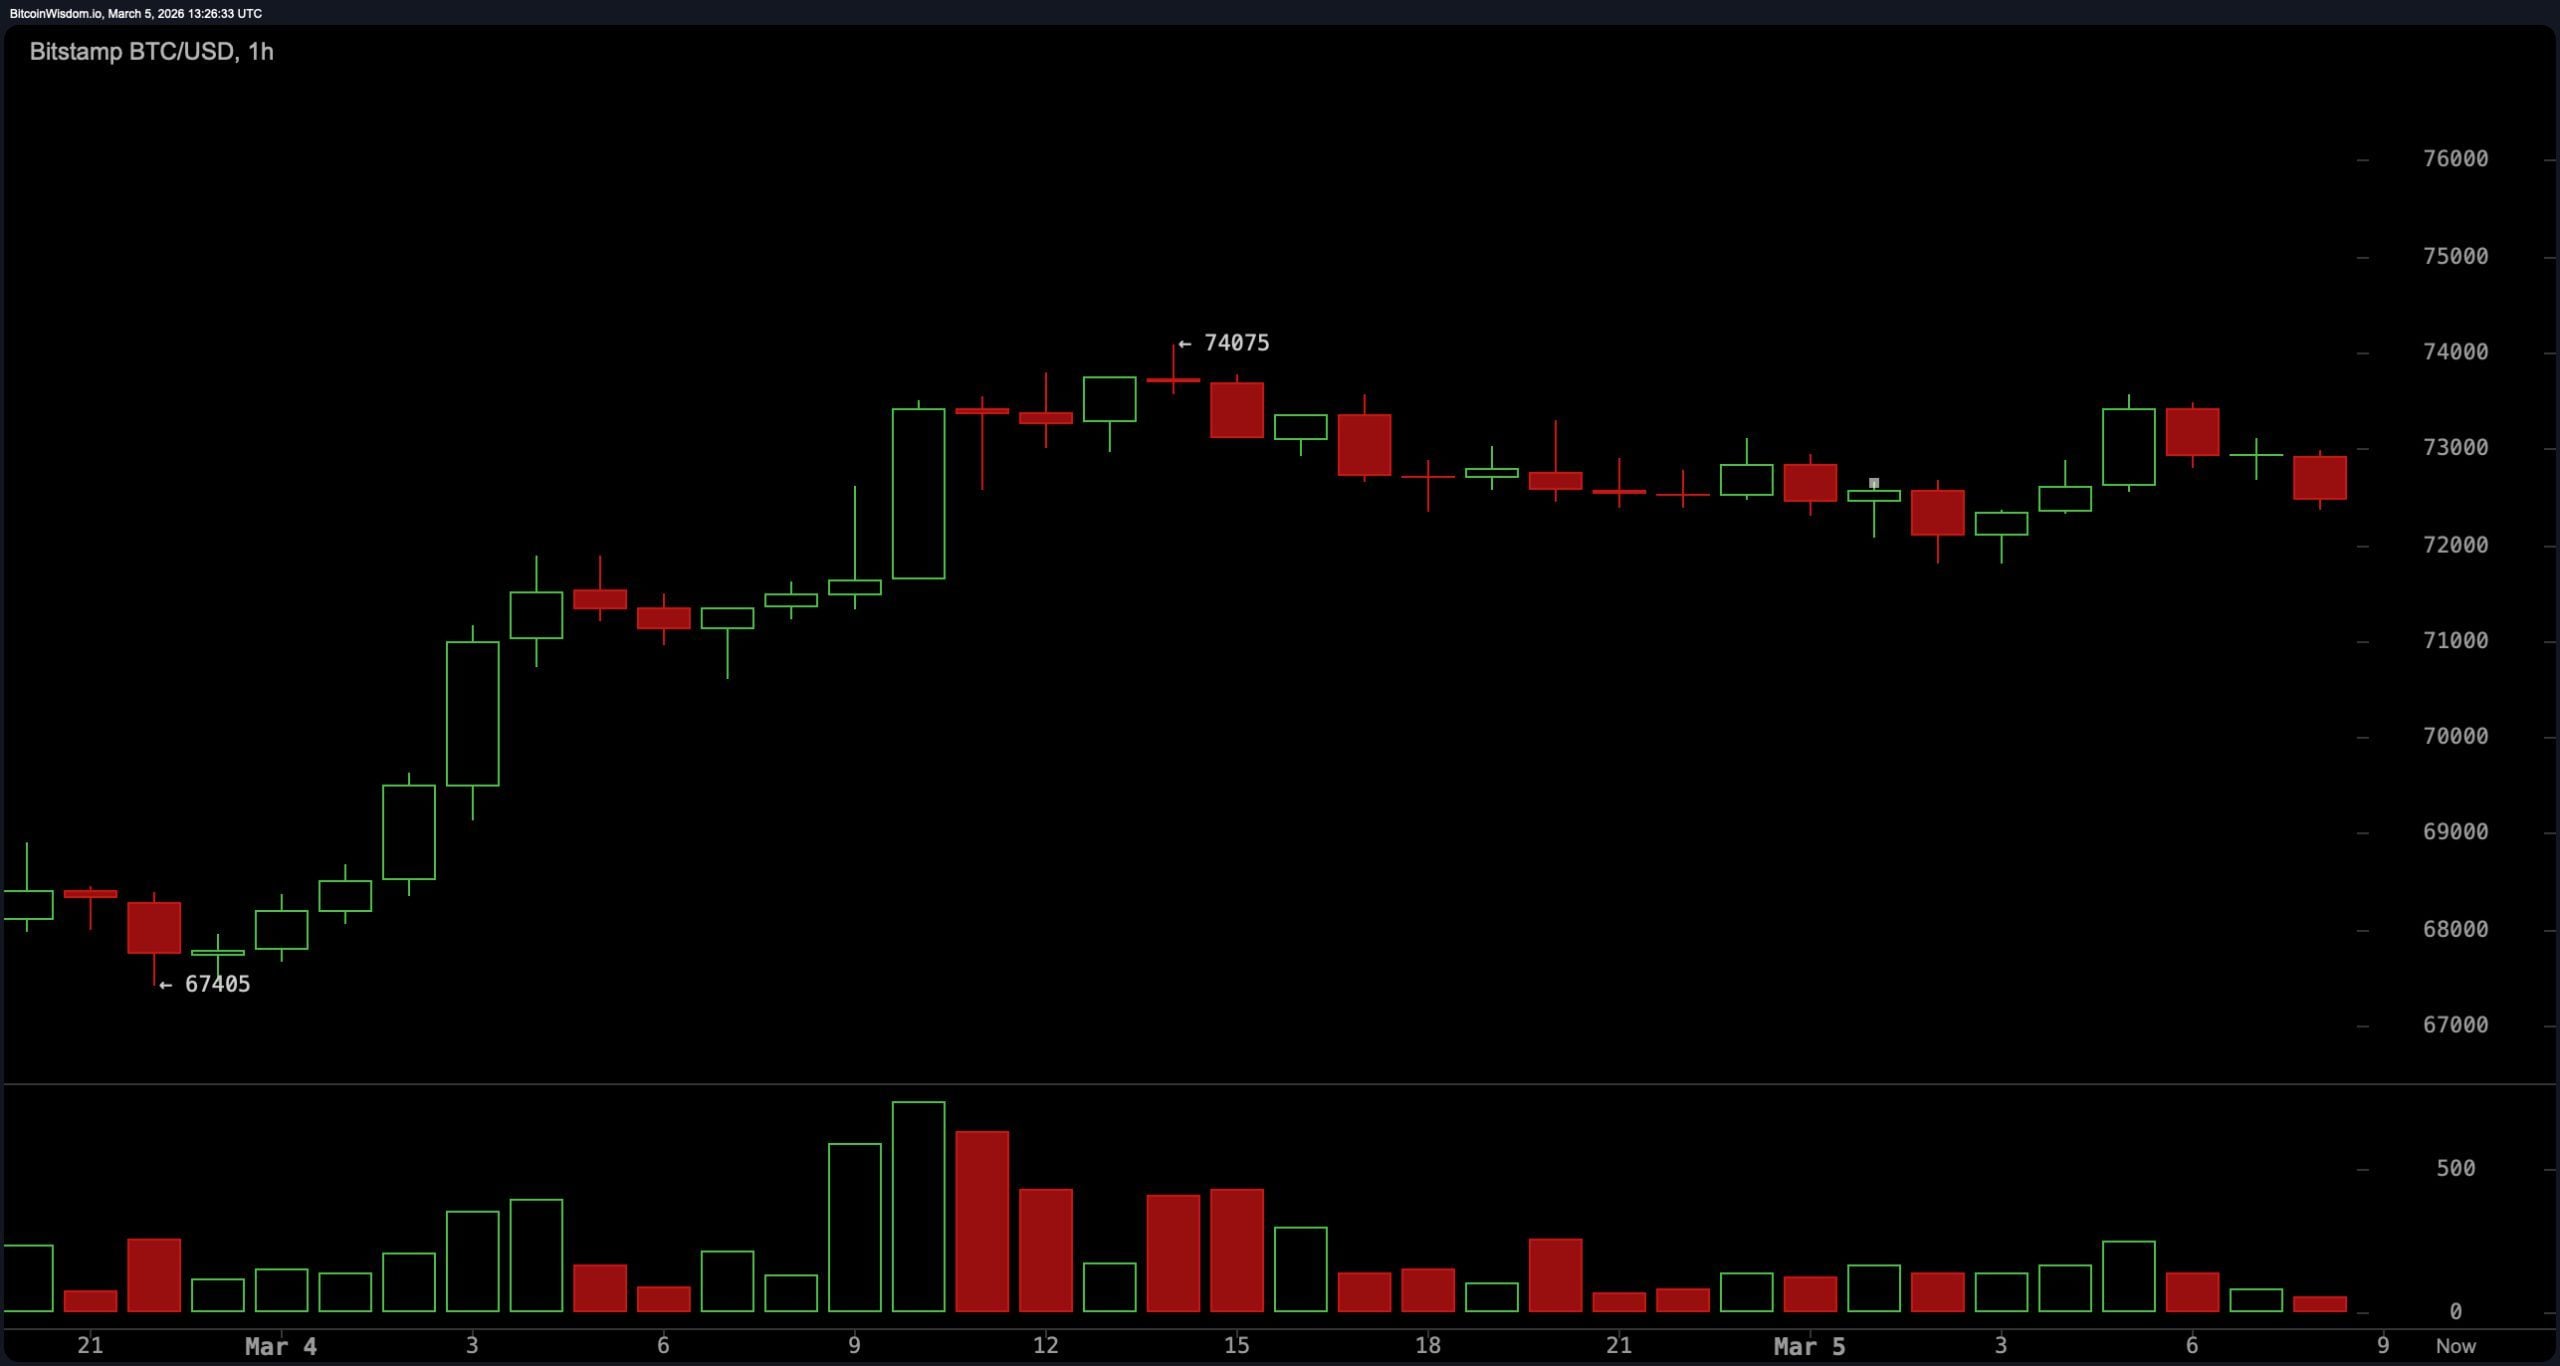
The one-hour bitcoin chart reflects the most immediate battle between bulls and bears after bitcoin briefly pushed toward $73,100 before quickly retreating. The spike was followed by a pullback that placed the price inside a narrow consolidation band between roughly $72,600 and $72,900.
That sequence created what technicians often call a failed breakout attempt, where the price touches resistance but lacks the strength to continue higher. Rejection candles forming near the upper portion of the range suggest hesitation from market participants who pushed bitcoin’s price higher earlier in the session. If price drifts back toward $72,600 again, the reaction at that level will likely dictate the next intraday move.
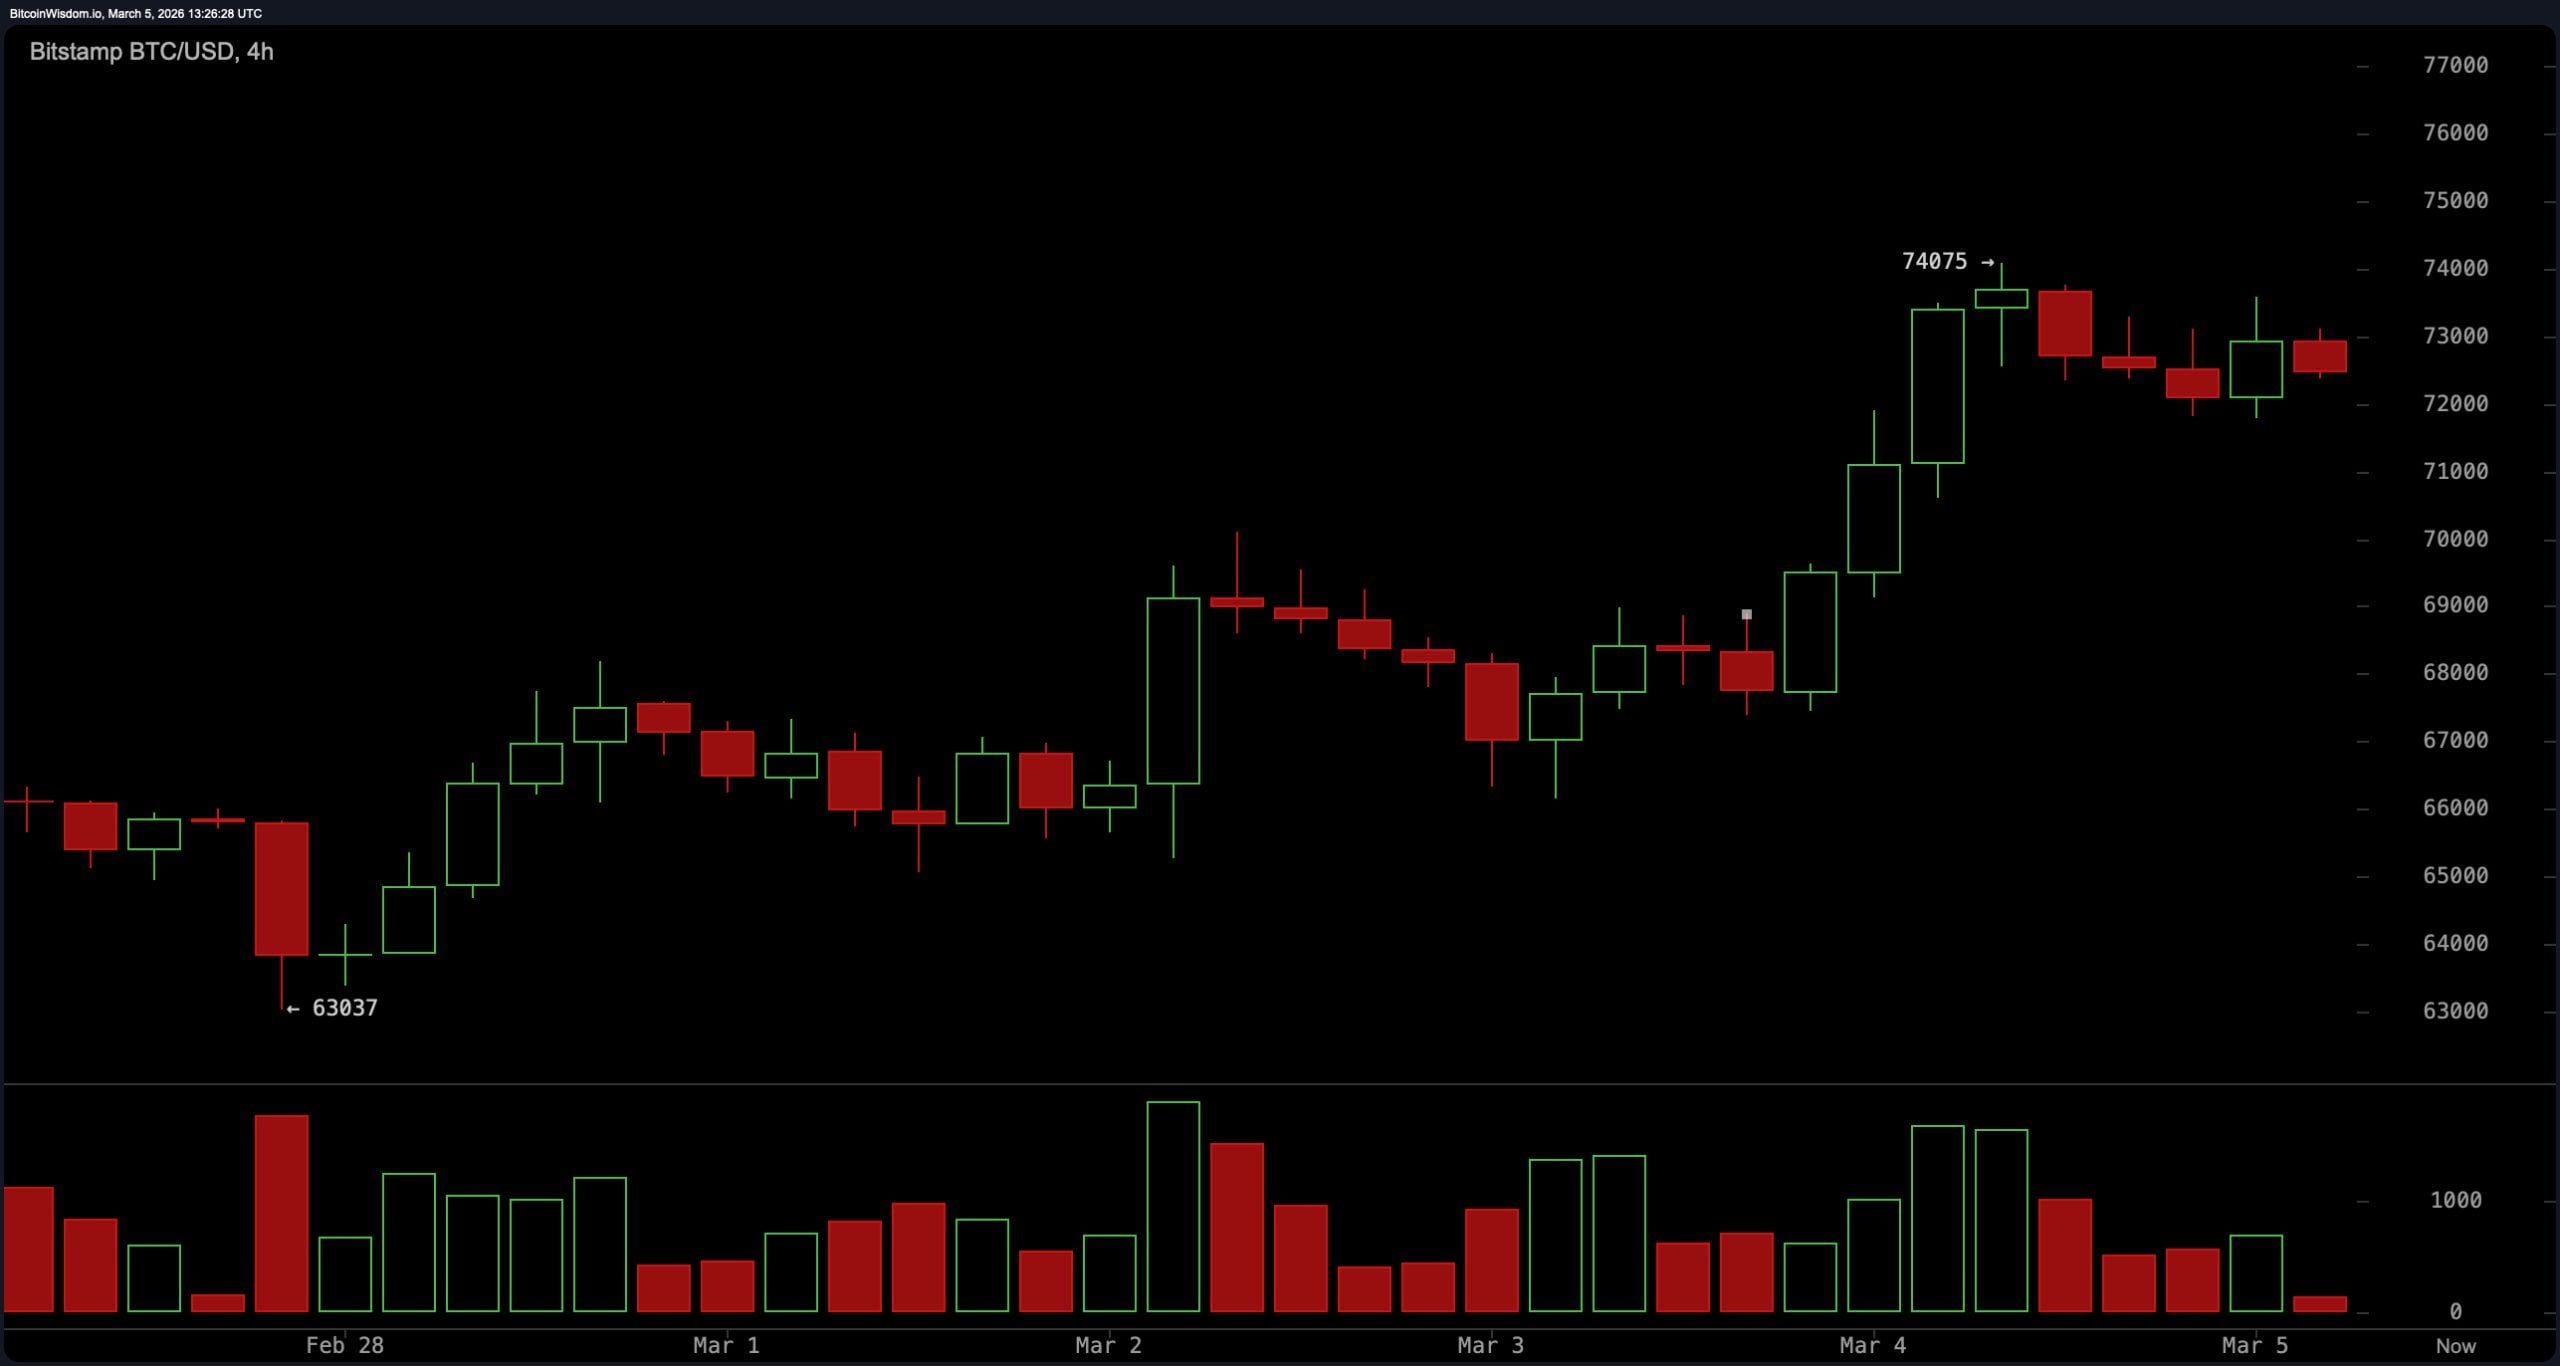
The four-hour bitcoin chart provides a broader view of the same rejection. During the session, bitcoin opened near $72,934, climbed to a high of $73,102, and then reversed lower, eventually closing around $72,666. The move produced a candle that finished near its lows, a structure often associated with fading momentum after a rally attempt. Volume during the move was roughly 100 BTC, notably thin participation for a breakout attempt of that size. When the price reaches resistance without strong participation, it often signals hesitation from larger market participants. As a result, the 4-hour chart currently hints at a developing lower high that could place pressure on the $72,600 support level if downside momentum builds.
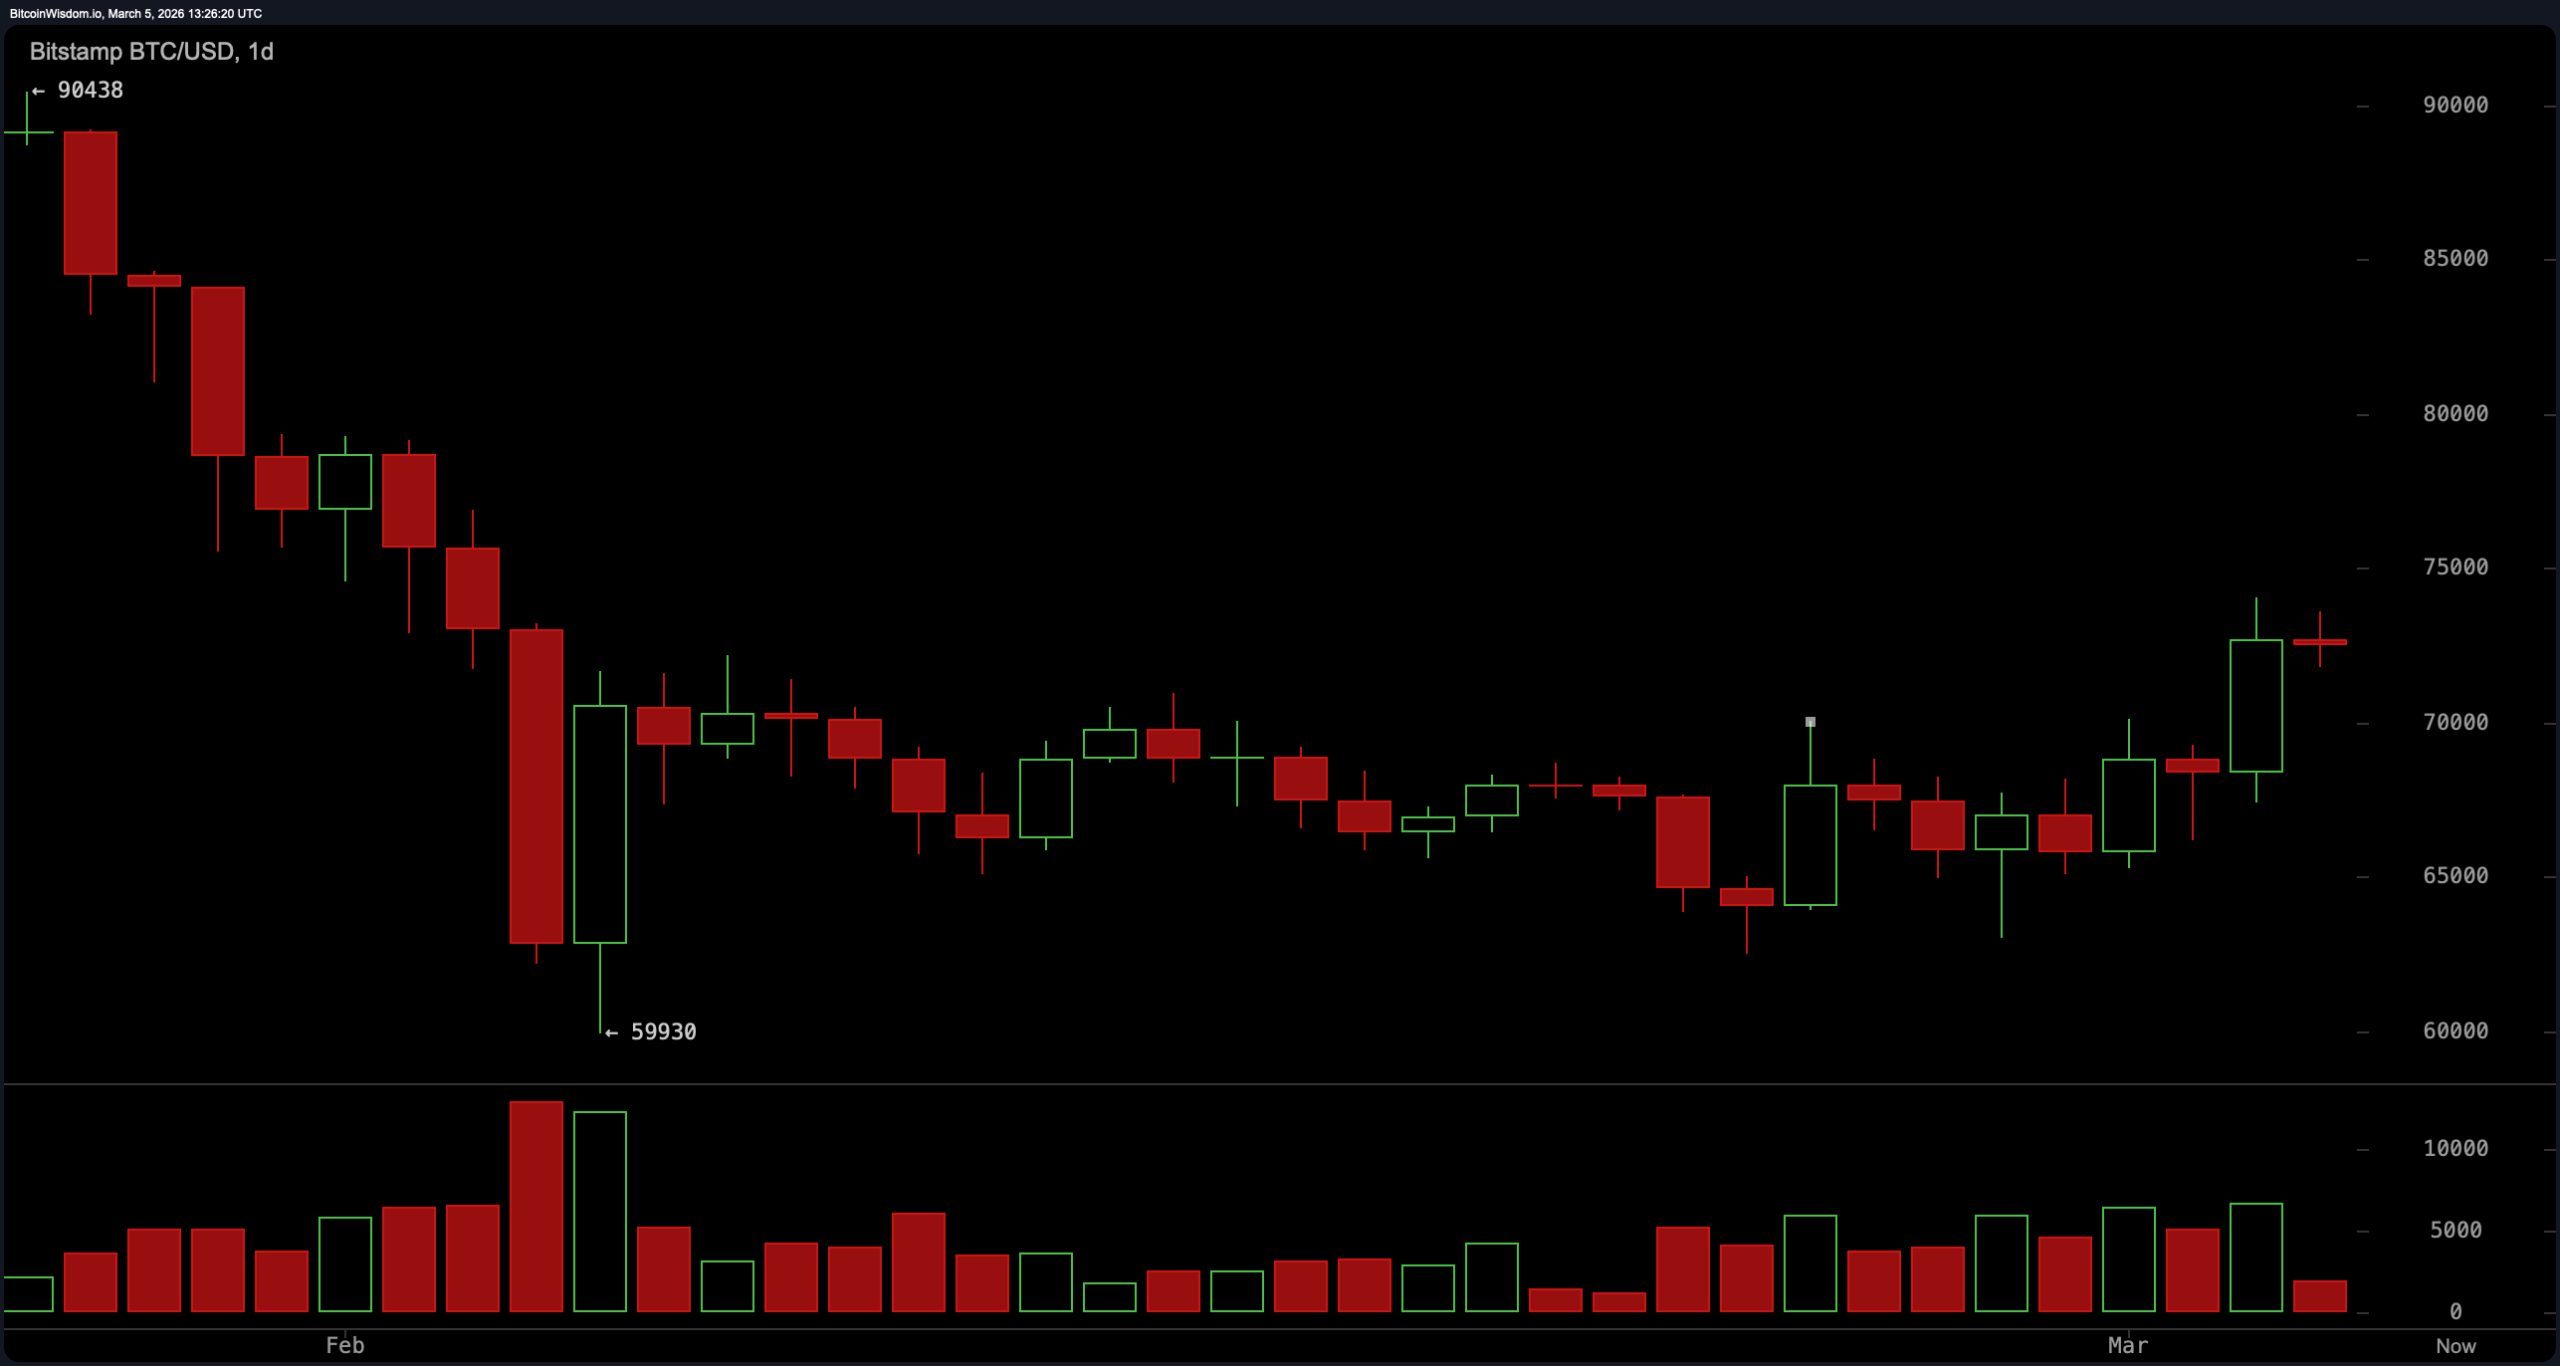
Bitcoin’s daily chart shows bitcoin settling into a consolidation phase rather than extending a directional trend. Price action has remained confined between roughly $72,600 and $73,100 after the spike toward resistance failed to produce sustained continuation. The rejection near $73,100 created another lower high within the broader structure, suggesting that the market is still struggling to push decisively through nearby resistance levels. At the same time, support around $72,600 has continued to hold, preventing a deeper retracement so far. This combination leaves the daily structure balanced between resistance overhead and support beneath, reflecting a market pausing after a recent rally attempt.
Oscillators on the daily chart reflect that same indecision. The relative strength index ( RSI), stochastic oscillator, commodity channel index (CCI), average directional index (ADX), momentum indicator, moving average convergence divergence ( MACD), and Williams percent range (Williams %R) all register neutral readings.
None of these indicators currently shows extreme conditions that would indicate strong directional pressure. Instead, the indicators are clustered in mid-range territory, reinforcing the broader view that bitcoin’s price action is consolidating rather than accelerating in either direction.
Moving averages add another layer to the mixed technical outlook. The 10-period simple moving average (SMA) and 10-period exponential moving average (EMA), along with the 20-period SMA and 20-period EMA, indicate short-term strength near current price levels. In contrast, the 50-period SMA, 50-period EMA, 200-period SMA, and 200-period EMA remain positioned in ways that point to broader downward pressure from longer timeframes. This split leaves the market caught between short-term support and longer-term resistance overhead, with key levels now clearly defined near $73,100 on the upside and $72,600 on the downside.
Bull Verdict:
If bitcoin maintains support near $72,600 and begins reclaiming the upper edge of the range, momentum could rebuild toward the $73,100 resistance level. A sustained move above that ceiling would invalidate the recent rejection structure and shift short-term momentum upward, potentially opening the door for another attempt to extend the rally beyond the current consolidation zone.
Bear Verdict:
If the price falls below $72,600, it would confirm recent signs of weakness. This could lead to further declines, potentially reaching $72,200 and then $71,800. This pattern suggests a continuing downward trend when looking at longer-term price charts.
FAQ 🧭
- What is bitcoin’s key support level right now?
Bitcoin’s immediate support sits near $72,600, with deeper support around $71,800 if that level fails. - What resistance level is bitcoin struggling to break?
Bitcoin recently tested resistance near $73,100 but was rejected after a brief breakout attempt. - What do the current bitcoin technical indicators show?
Daily chart oscillators such as the relative strength index ( RSI) and moving average convergence divergence ( MACD) remain neutral, signaling limited directional momentum. - What could trigger the next bitcoin price move?
A decisive move above $73,100 or a breakdown below $72,600 could determine bitcoin’s next short-term trend.
Read More
- USD COP PREDICTION
- Silver Rate Forecast
- SOL PREDICTION. SOL cryptocurrency
- SPX PREDICTION. SPX cryptocurrency
- USD CAD PREDICTION
- Brent Oil Forecast
- UFC & Polymarket: Fists, Foresight, and Frenzy!
- Bitcoin Frets and Fears: The Great Crash of 2025! 🚨💥
- USD THB PREDICTION
- Gold Rate Forecast
2026-03-05 17:27