Another day in the Bitcoin ballroom, where the DJ is asleep at the wheel 🎻 and the crowd’s doing the cha-cha of confusion. Prices are trapped in a time loop between resistance and support zones, with technical indicators waving yellow flags like a group of panicked tourists lost in a maze.
Bitcoin Chart Outlook
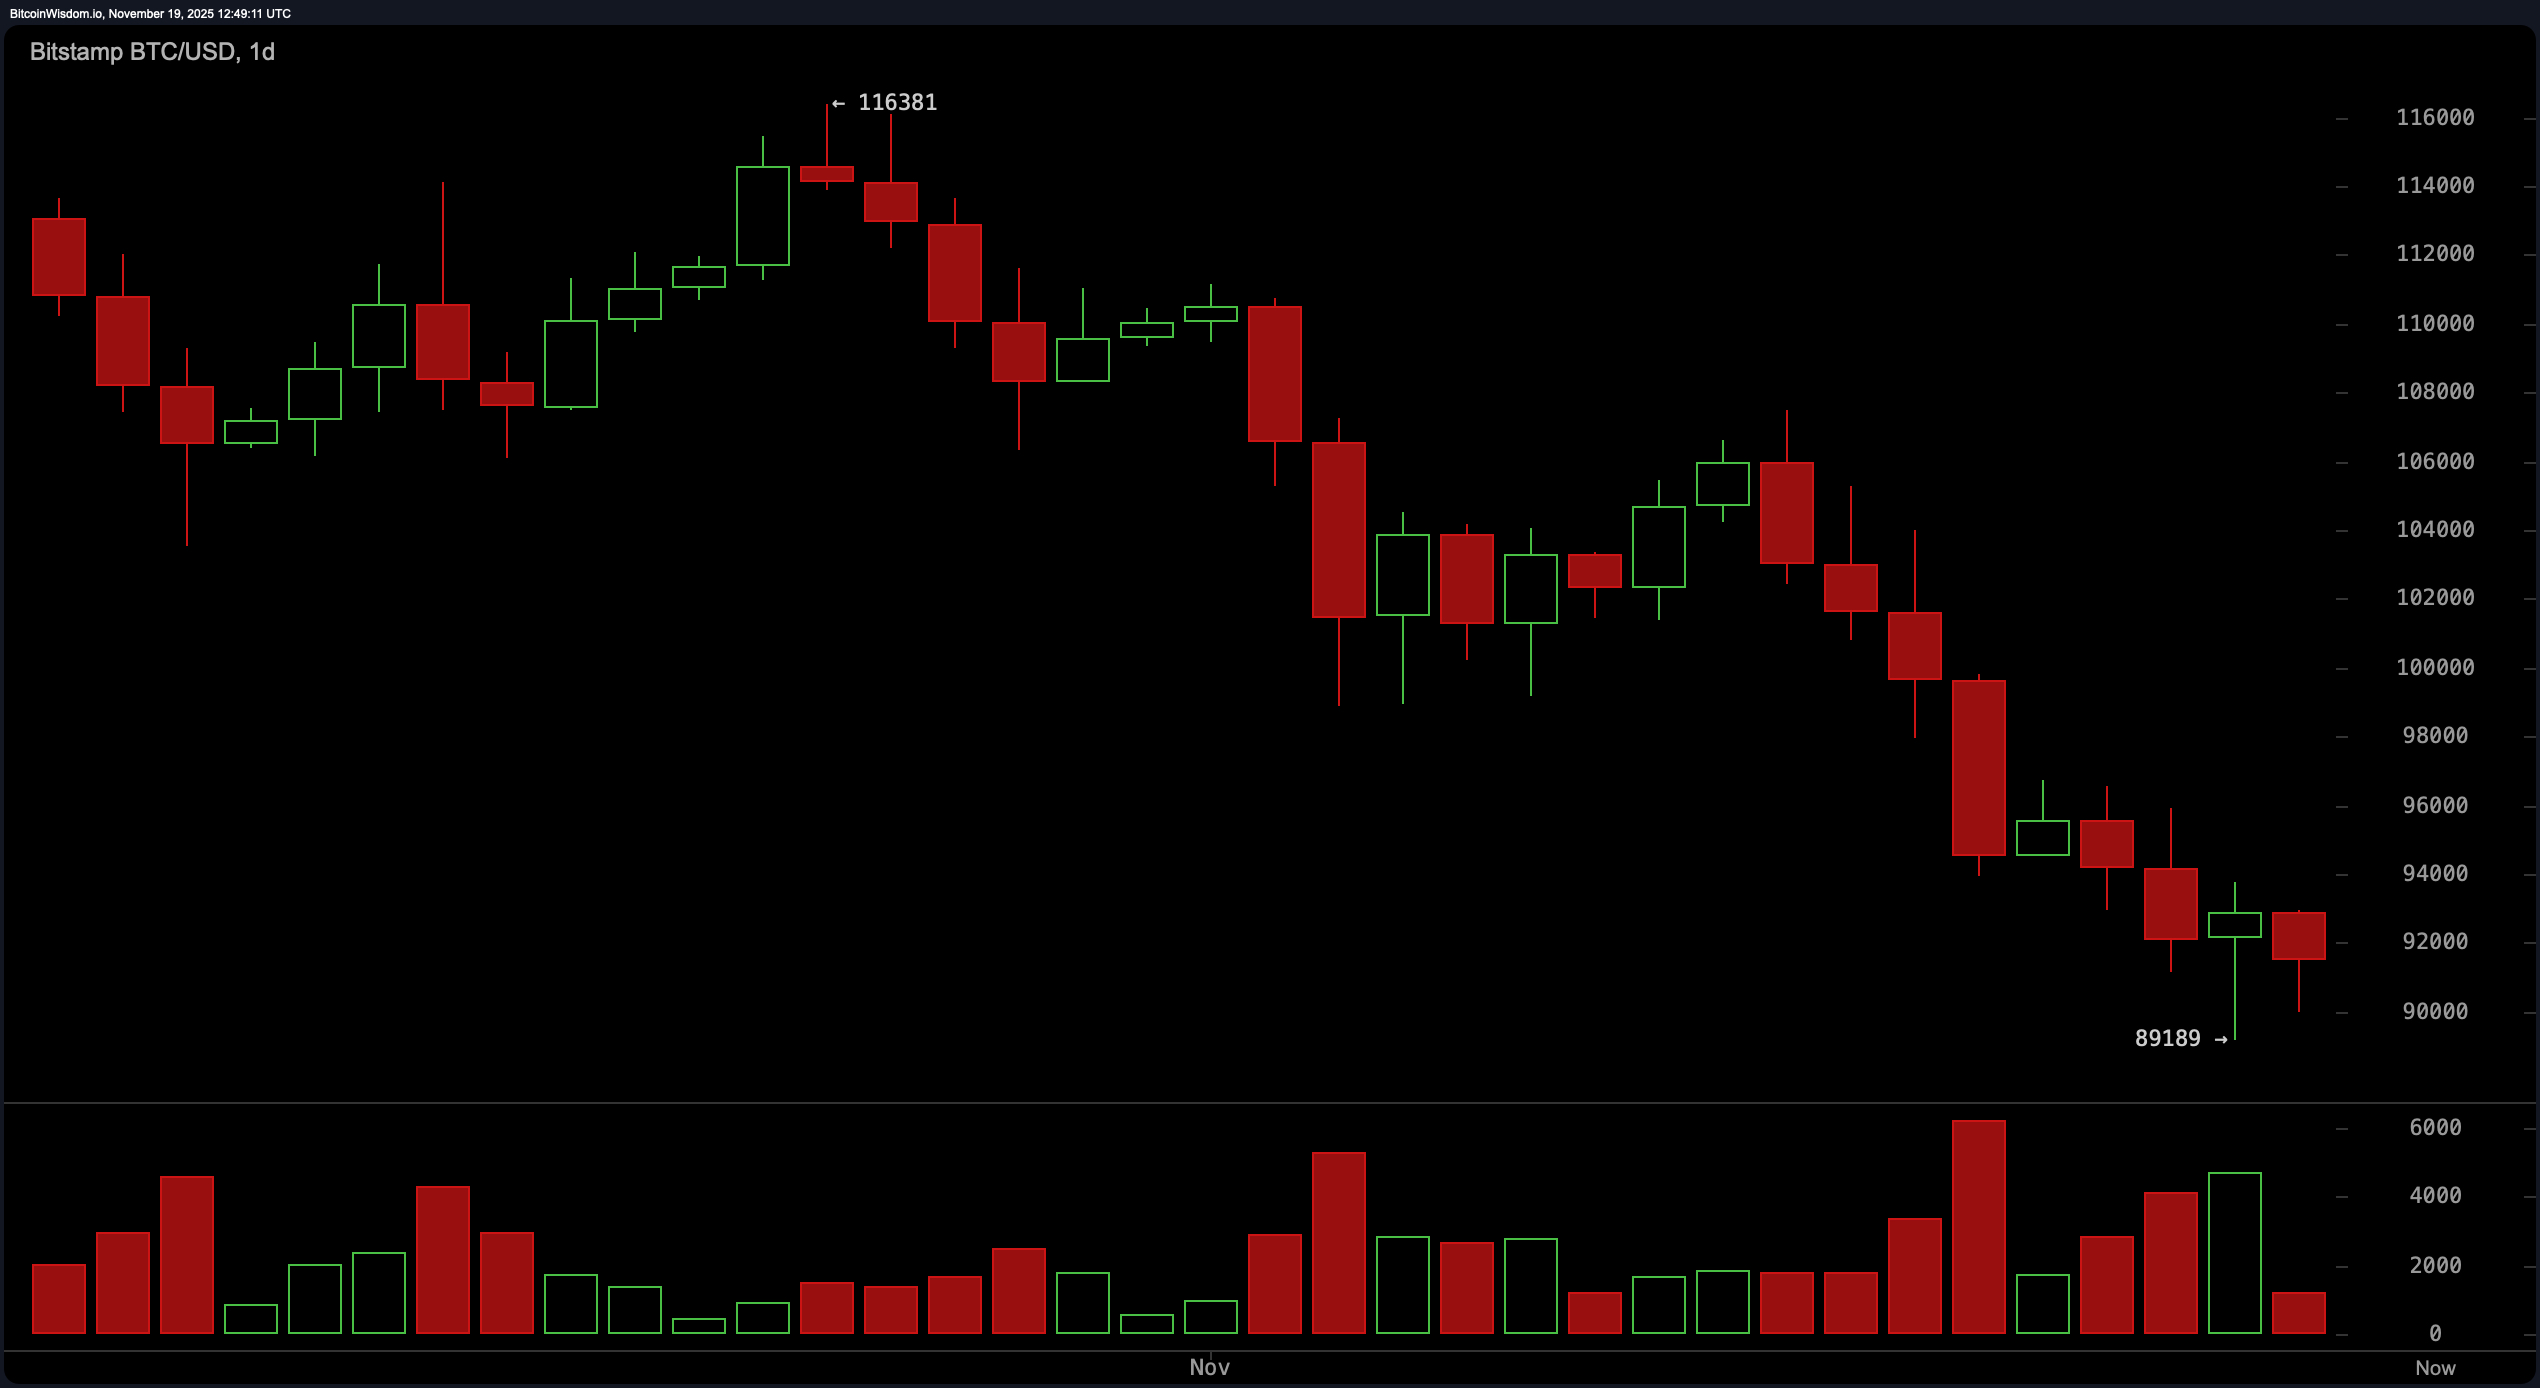
The daily chart tells a tale of glittering $116K glory now drowned in a sea of red volume bars, like a sinking ship with no lifeboats. The subsequent green candles? More of a polite cough than a roar. The trend remains bearish until Bitcoin reclaims the mid-$96K range, which currently feels about as likely as a snowball surviving in a sauna. For now, the $89K-$90K band is a flimsy raft in a storm, and any rally toward $96K-$100K risks capsizing on the rocks of past failures.
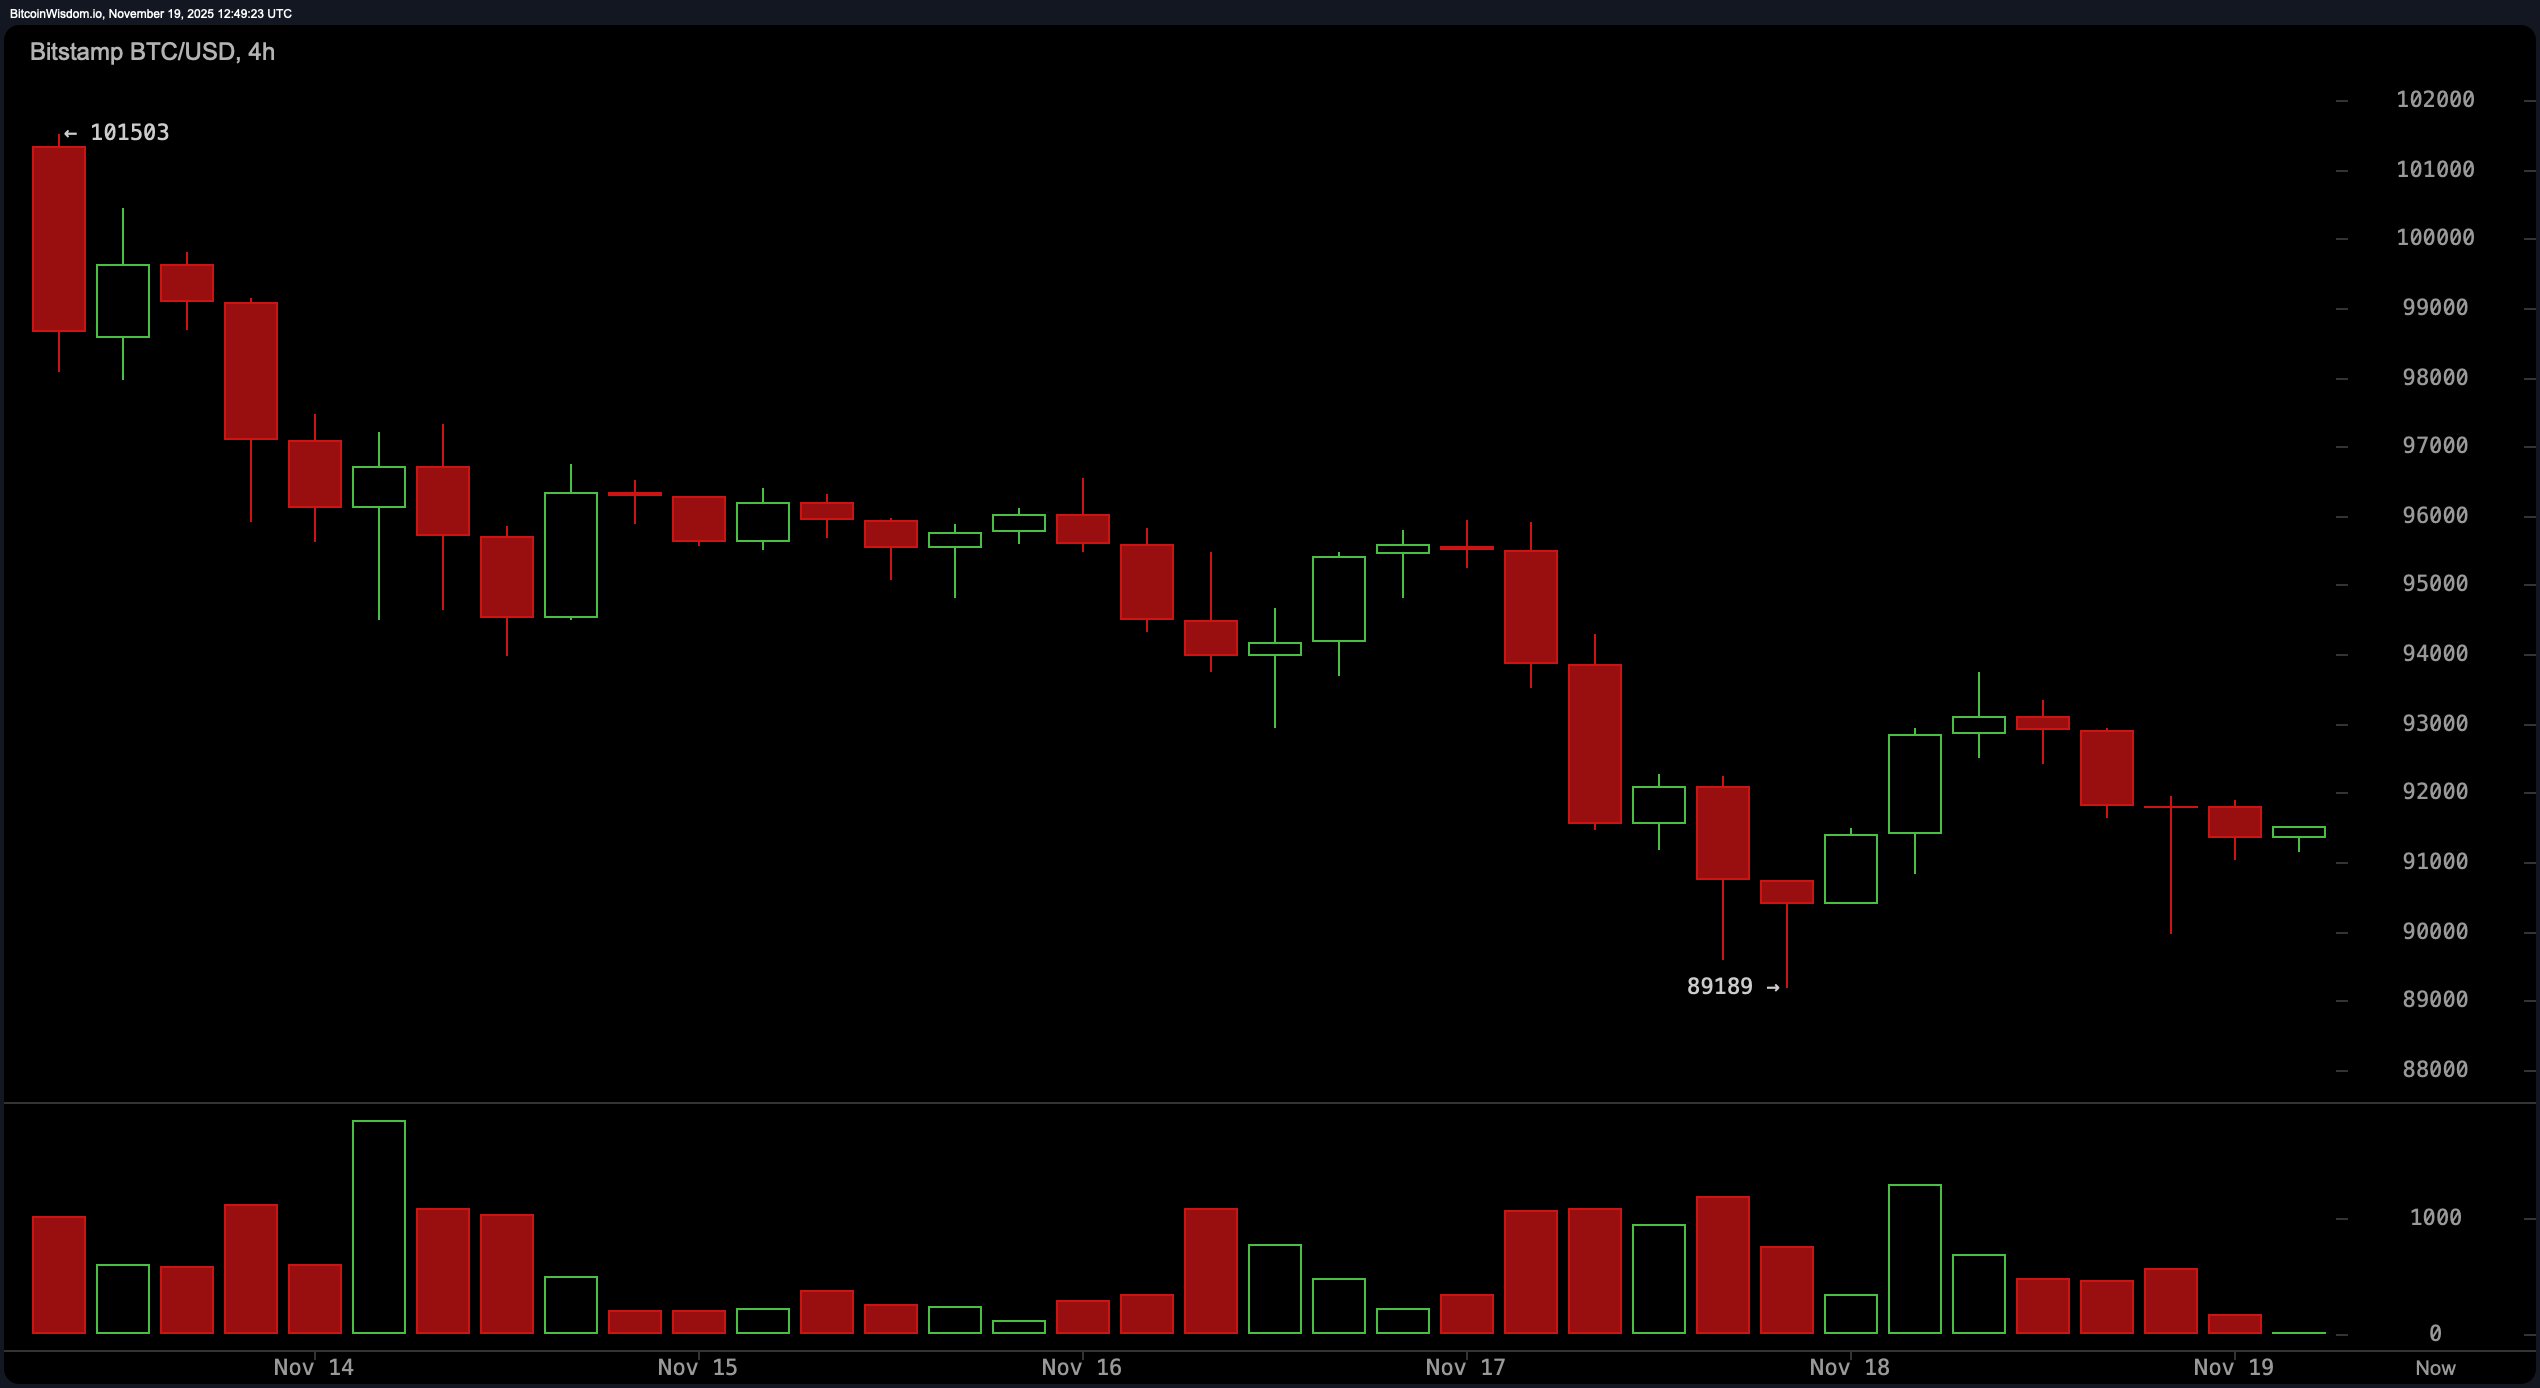
Bitcoin’s four-hour chart resembles a falling anvil with all the elegance of a toddler learning to walk. The bounce from $101,503 smacked into the $93K resistance like a bird trying to fly through a glass window. Sellers are holding the line with the tenacity of a caffeinated raccoon guarding its stash. Momentum? It’s napping in a hammock somewhere, sipping tea. Until Bitcoin breaks above $93.5K on meaningful volume, traders should prepare for a nap of their own.
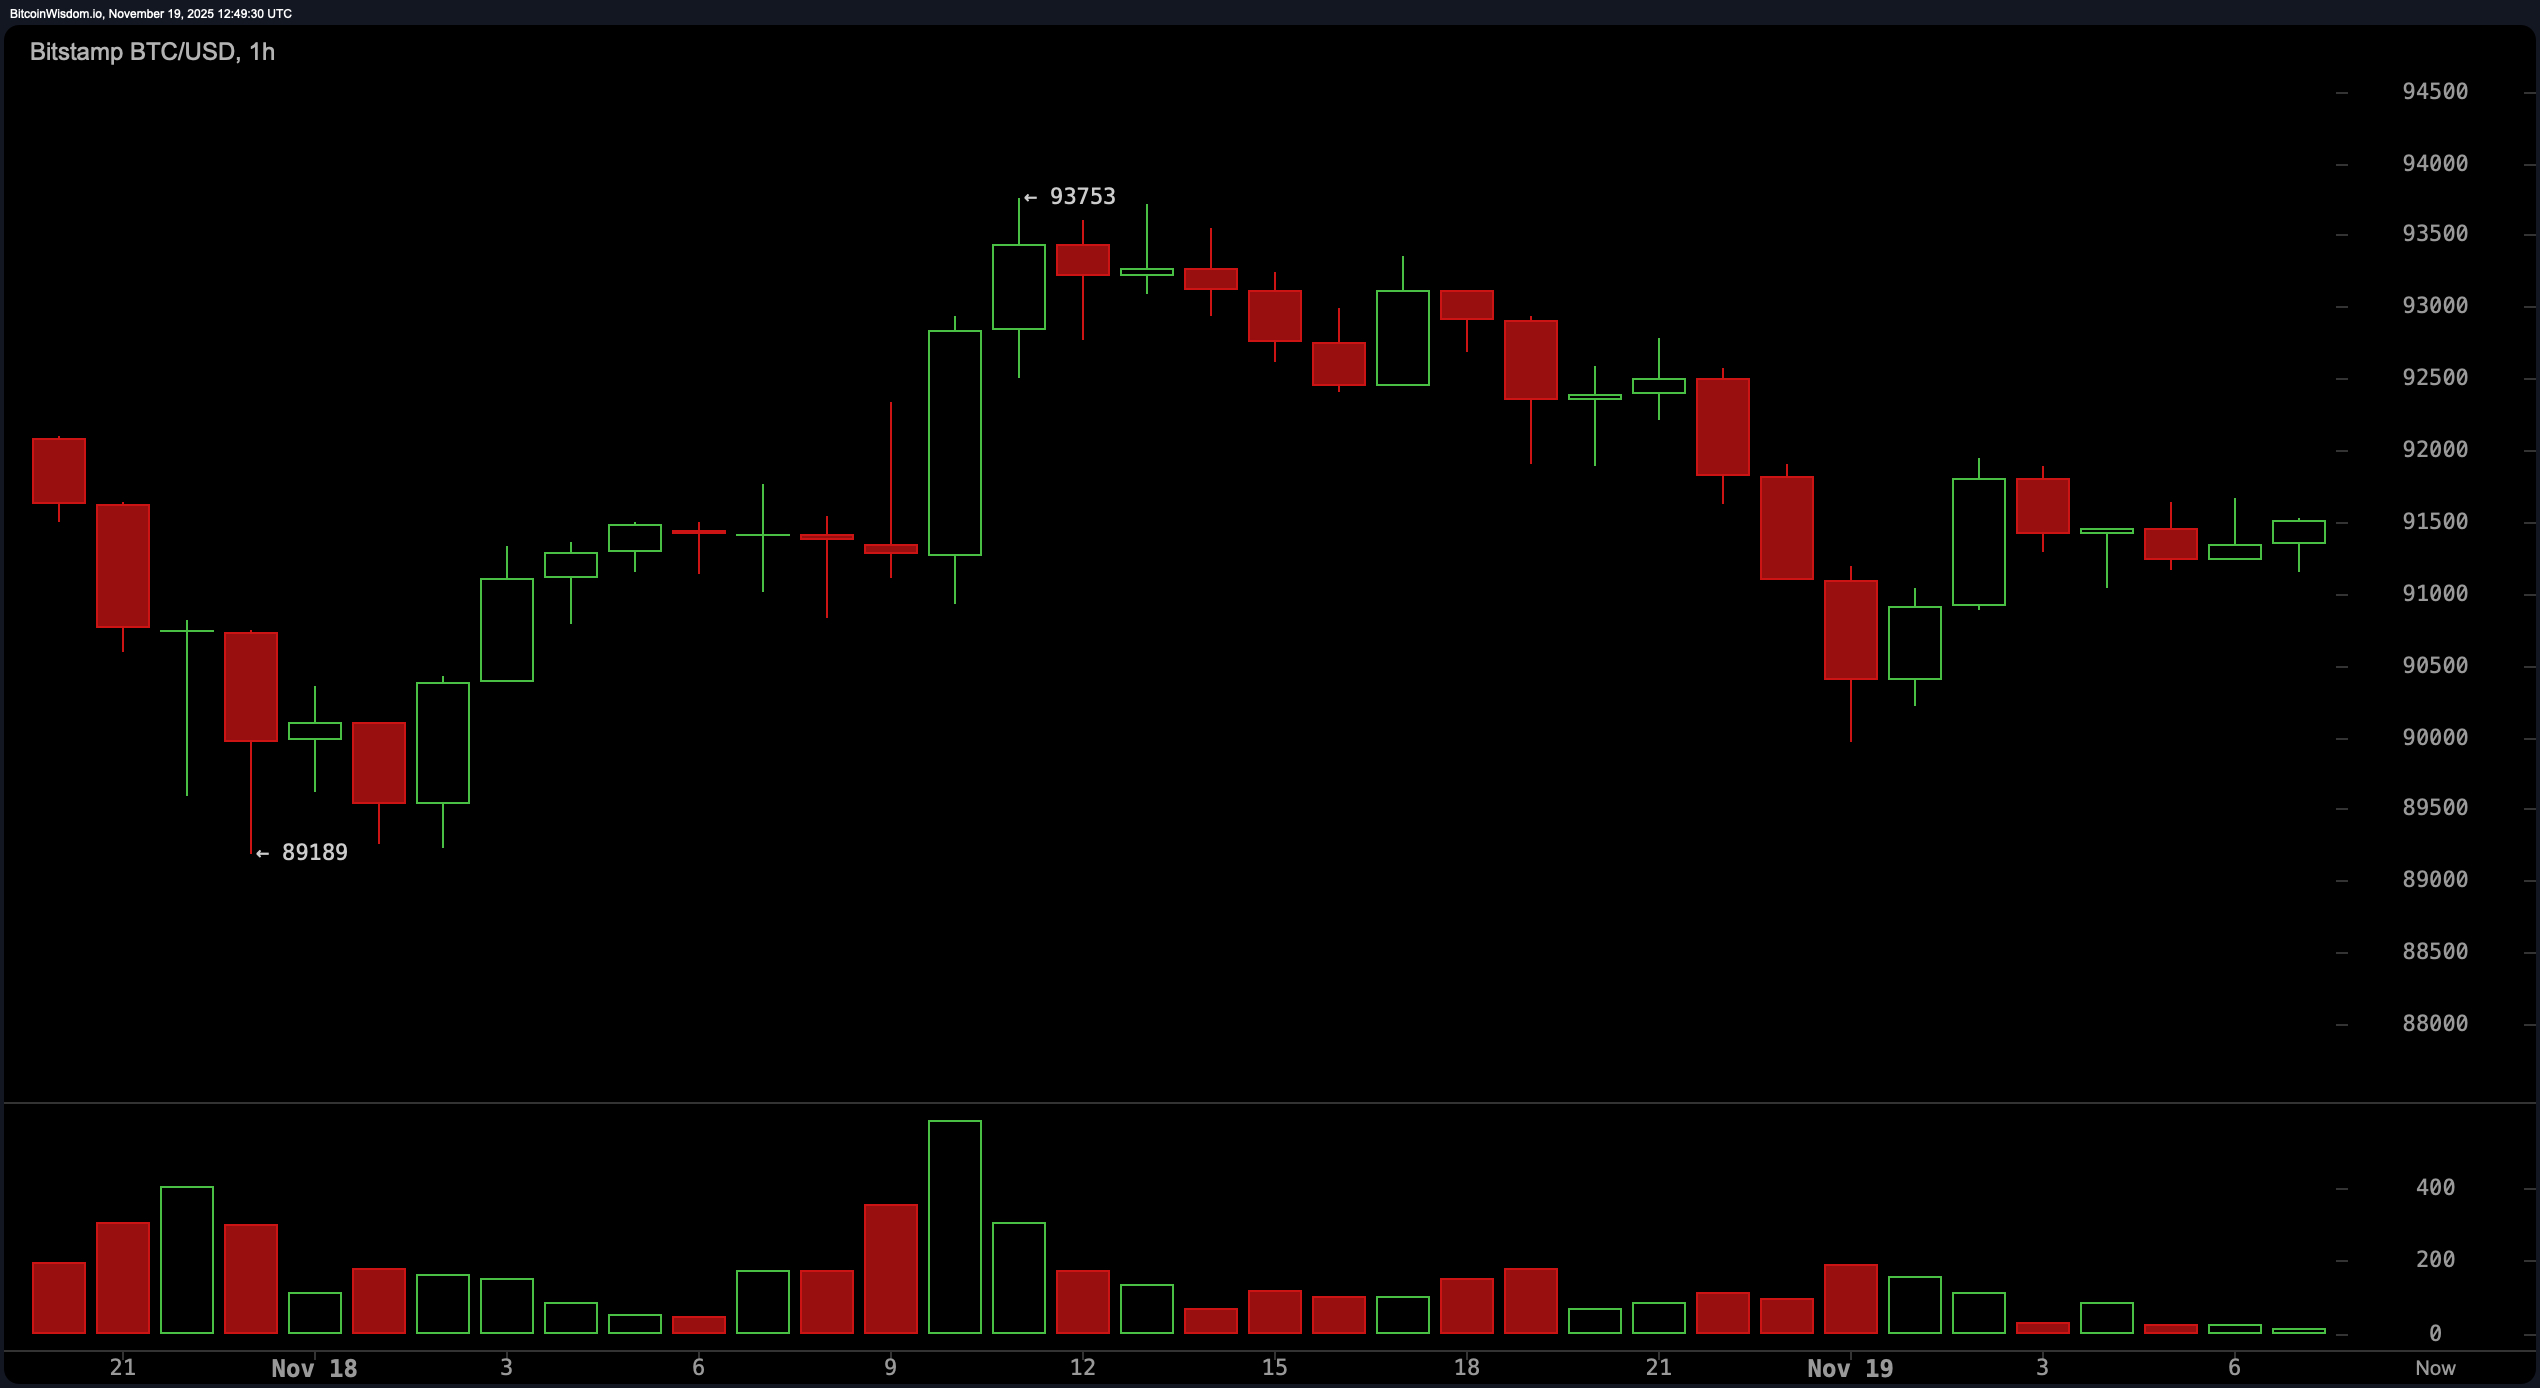
The hourly chart paints a drama-filled soap opera: a bounce from $89K hits a ceiling at $93.7K, then rolls back down like a deflated balloon. Volume is drier than a Martian desert, and the price is boxing itself into a playpen of $90.5K-$93K. Breakouts? They’re as rare as a bear market ending on a Tuesday. Eyes glued to $93.7K (bulls) and $90.5K (bears)-this is the moment where the universe decides if Bitcoin deserves a sequel.
Oscillators are throwing a party for the saddest crowd. RSI at 29? That’s not a number-it’s a cry for help. The stochastic oscillator is barely above water, and the CCI is so negative it could power a black hole. The ADX is hinting at a trend, but it’s like a whisper in a hurricane. MACD and momentum indicators? They’re on Team Bear, sipping coffee and plotting your demise. 🕳️
Moving averages are Bitcoin’s iron ceiling, with the 10-period EMA at $96.1K and the 200-period SMA at $110.4K. These aren’t just numbers-they’re cosmic laws written by the gods of correction. Bitcoin is still stuck in a time warp of downward spirals, and the only thing moving is your blood pressure. 🩸
So, where does this leave us? Traders are advised to bring snacks and patience, as the waiting game has officially begun. Until Bitcoin escapes this box with a decisive breakout, the vibe remains “cautious” (read: terrified). The universe is watching, and it’s judging you. 😬
Bull Verdict:
If Bitcoin breaks above $93.7K with the vigor of a caffeinated kangaroo, bulls might finally get their moment to shine. A close above $96K could trigger a trend reversal-or at least a Netflix special. 🎬
Bear Verdict:
Failure to reclaim $93.5K means the bears are still in charge, and the trapdoor to $89K-$88K is wide open. Hold tight, or risk becoming a cautionary tale. 🚨
FAQ ❓
- What is bitcoin’s current price today, November 19, 2025?
Bitcoin is trading at $91,344 as of today-enough to buy a very expensive cup of coffee ☕️ (but not enough to escape the gravity of this market). - Is bitcoin trending up or down right now?
Downward, like a rock with a personal trainer. 🏋️ - What’s the key support level for bitcoin this week?
$89K-$90K, but don’t get too attached-it’s as flimsy as a meme. 🤡 - What resistance level could stop bitcoin from climbing?
Sellers are defending $93.5K-$96K like it’s the last castle in a war. 🏰
Read More
- Gold Rate Forecast
- Brent Oil Forecast
- USD CNY PREDICTION
- Silver Rate Forecast
- 🚨 Last Call for $BEST: The Wallet Revolution Ends in 3 Hours! 🚀
- MSTR’s $1.44B Cash Cushion: Bitcoin Lifesaver or Doomscroll Fuel? 🚀💸
- HYPE PREDICTION. HYPE cryptocurrency
- Altcoin Frenzy: BANK Soars 60% While MET Plays Catch-Up 😱💸
- Nasdaq’s Nano Labs Plots Billion-Dollar BNB Grab—Did Binance Just Get a New Frenemy?
- Privacy Coin Frenzy: Zcash’s $741 Surge Stirs the Crypto World
2025-11-19 17:09