Bitcoin’s price is moving within a narrower and narrower range, forming a triangle pattern. The price has repeatedly bounced off a key support level, hinting that a significant price swing – either up or down – is likely coming soon.
Summary
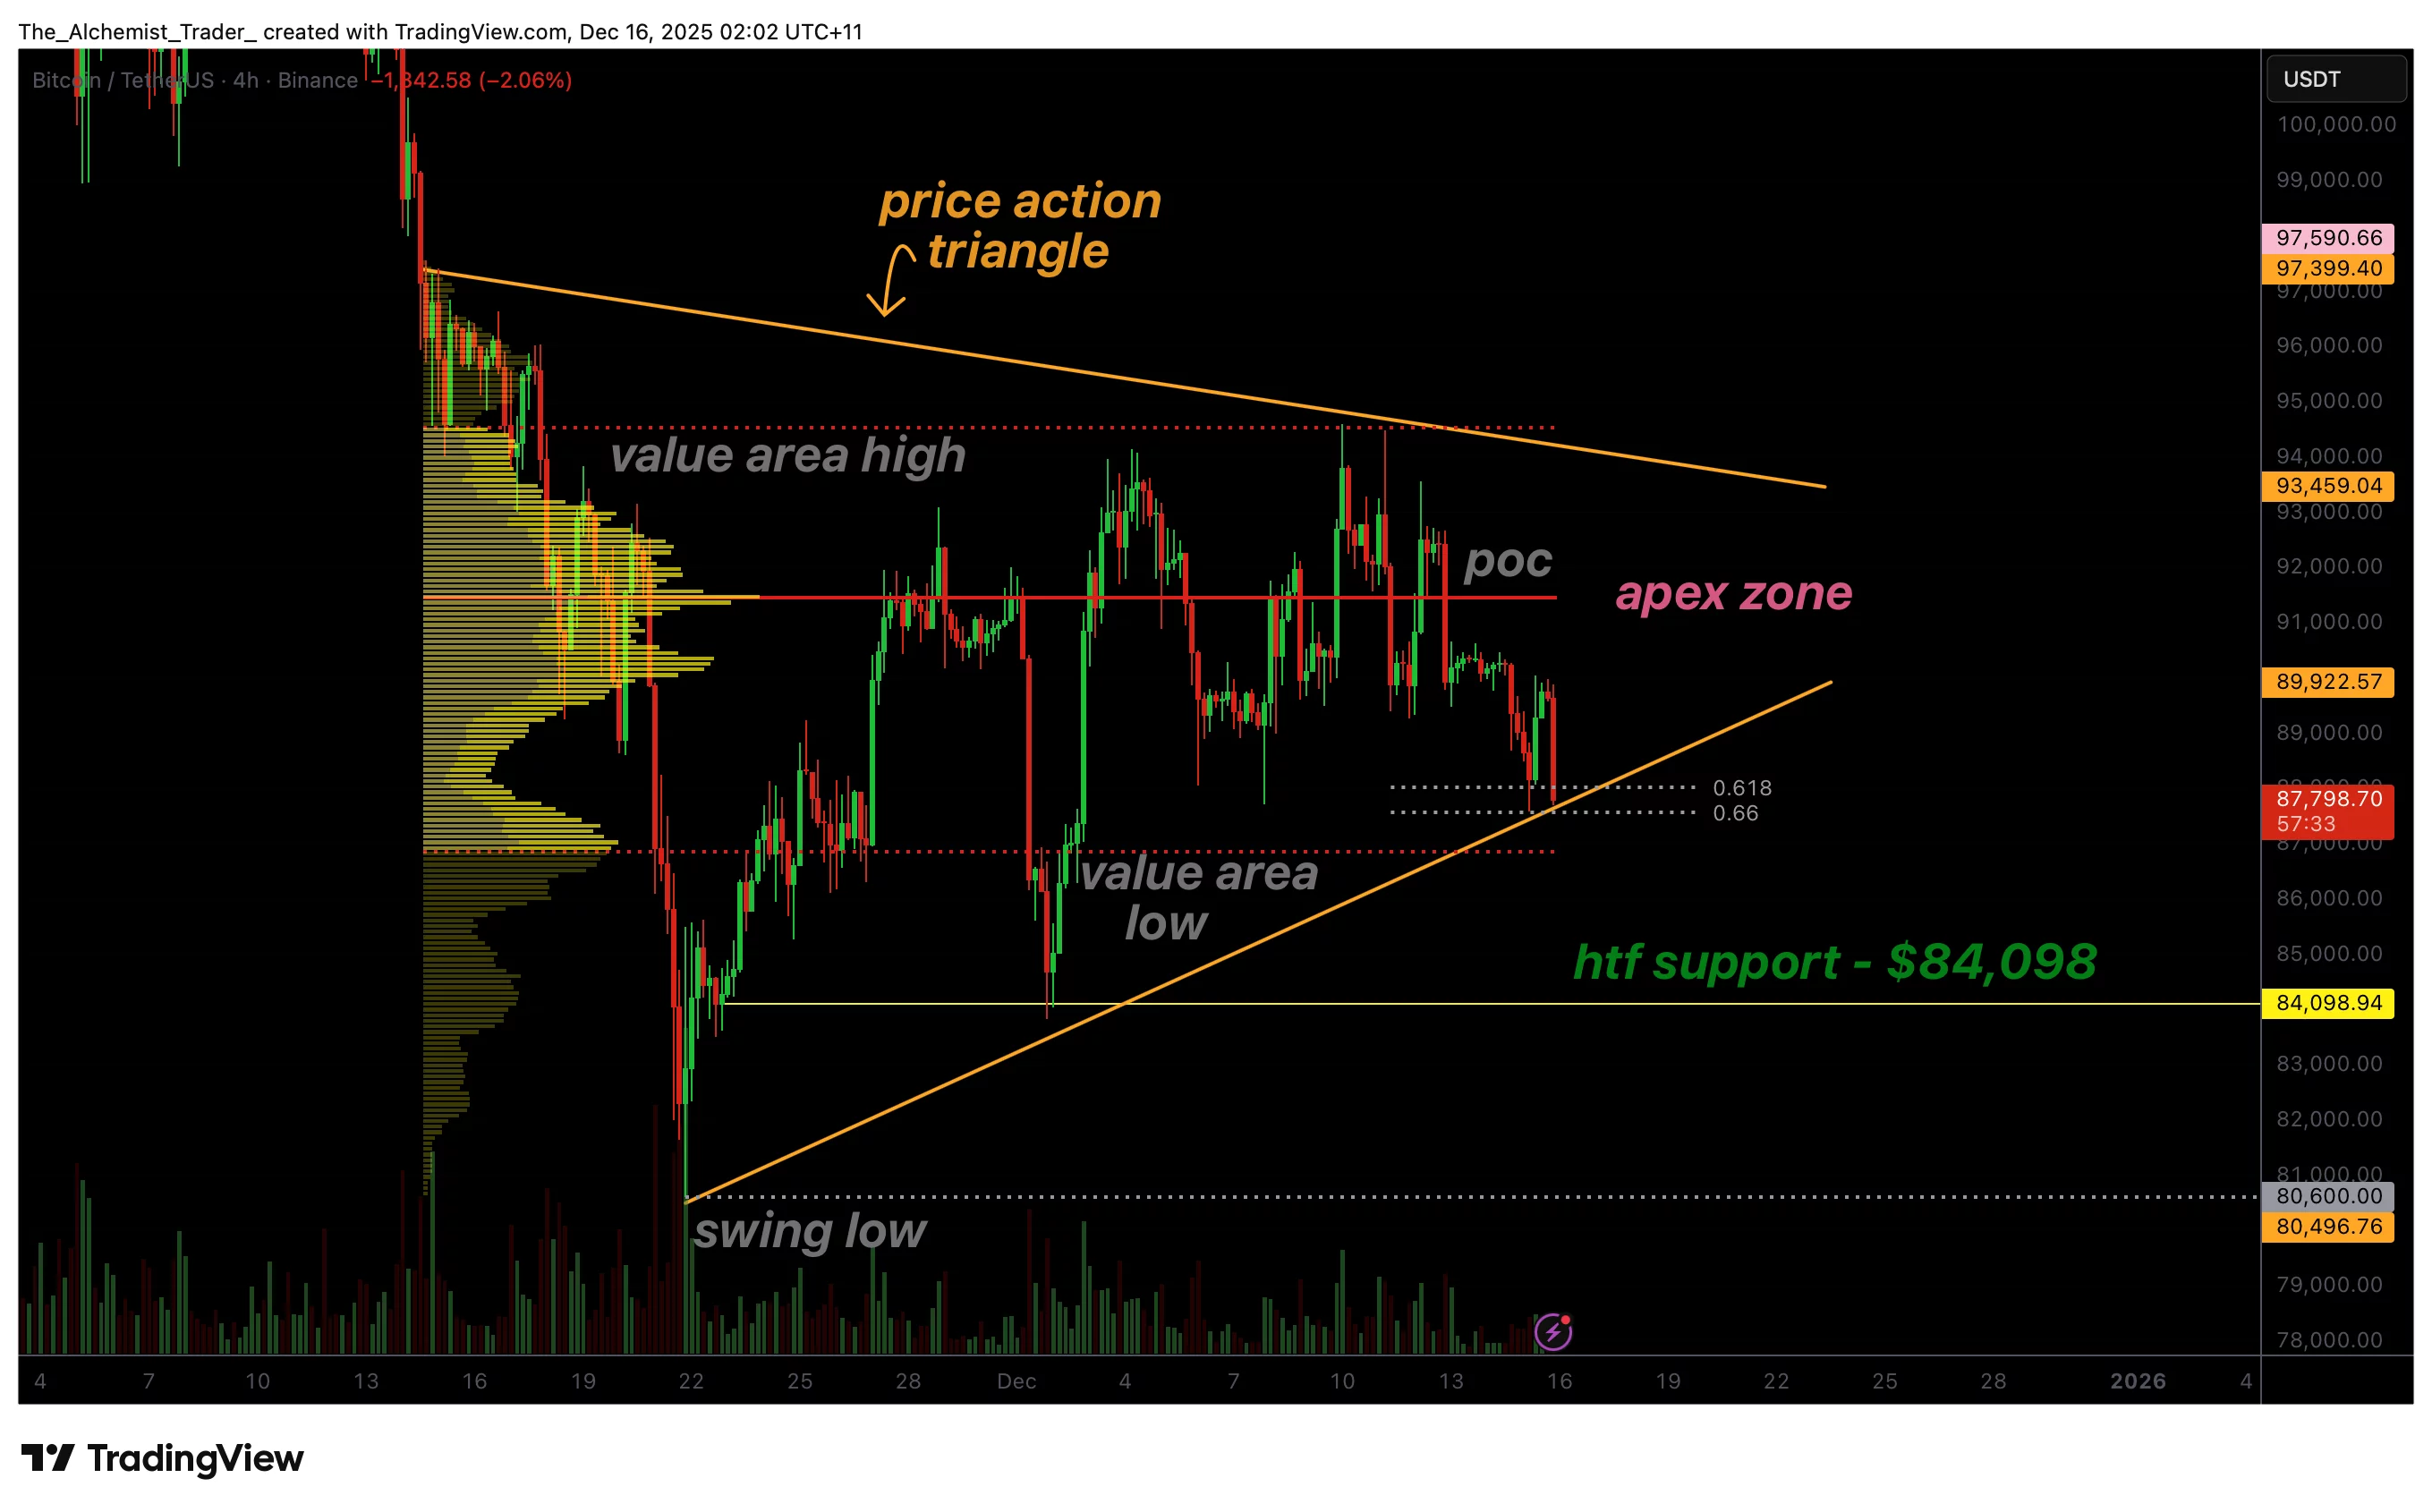
- Bitcoin respects dynamic triangle support on multiple tests.
- Value area and 0.618 Fibonacci confluence support the structure.
- Breakout likely as price squeezes toward the triangle apex.
Bitcoin’s price is currently stabilizing, moving within a tight triangular pattern. This often happens before a significant price swing, and with the price nearing the end of this pattern, a major move up or down seems likely soon.
Although it’s unclear which way prices will move, several technical indicators suggest a substantial price change is likely to happen soon.
Bitcoin price key technical points
- Bitcoin respects dynamic triangle support, bouncing precisely from the lower trendline on multiple attempts.
- Confluence between the value area and the 0.618 Fibonacci retracement strengthens the case for a bullish reaction.
- Price is approaching a high-time-frame apex, increasing the probability of an imminent breakout.
Bitcoin’s price hasn’t been moving strongly in either direction lately. Instead, it’s been fluctuating within a smaller and smaller range, forming a triangle pattern with decreasing peaks and increasing troughs.
The market appears to be stabilizing, with the forces of buying and selling becoming more balanced. This narrowing range typically means less price fluctuation, but often comes before a significant price jump or drop. Meanwhile, Strategy’s recent Bitcoin purchase of 10,625 coins emphasizes the risks for MSTR stock, as its value is increasingly tied to the future direction of Bitcoin’s price.
Bitcoin consistently bounces back from a key support level marked by the lower edge of a triangle pattern. The price has precisely held this level during several attempts to break below it, showing significant buying activity. Each time the price successfully defends this support, it strengthens the triangle pattern and suggests selling pressure is being handled, preventing a steeper decline.
The setup looks increasingly positive because a key support area is forming. This support comes from where the value area aligns with a 61.8% Fibonacci retracement level near the bottom of the triangle. These Fibonacci levels often signal potential price reversals during periods of sideways trading, and when combined with volume profile data, they create a strong base of support. This combination suggests that the recent price increases aren’t just temporary fluctuations, but a sign that buyers are actively defending this price level.
Bitcoin is still trading within a defined range, and it’s not yet clear whether the price will go up or down. The upper limit of this range is currently preventing any strong upward movement. This back-and-forth isn’t necessarily a sign of a problem; it’s common to see this kind of stability before a major price change.
Looking at how the market is structured, the current tightening price range indicates that buyers and sellers are accumulating positions on both sides. When prices break out of these triangular patterns, they often move quickly towards where those accumulated orders are, resulting in a strong and sustained price move.
As the price gets tighter and tighter, the chance of fake price movements goes down, and a real breakout becomes more likely. This is especially true for Bitcoin right now, as it could fall to around $75,000 with the uncertainty surrounding the Bank of Japan, which might trigger a significant price swing in either direction.
As I’ve been observing the market, price movements are currently stable within this established pattern. However, the overall conditions suggest we should be prepared for a significant move rather than trying to guess when it will happen. I believe it’s more effective to focus on the pattern’s structure itself, and wait for a clear signal – a definite breakout beyond the triangle’s limits – before acting. Trying to anticipate the move is less reliable than reacting to confirmed momentum.
What to expect in the coming price action
Bitcoin is expected to rise significantly once its price reaches the peak of its current triangular pattern. For now, the price might stay within a limited range, but a sharp price move – either up or down – is becoming more likely soon, and the breakout will reveal the direction.
Read More
- Gold Rate Forecast
- USD CNY PREDICTION
- Silver Rate Forecast
- Brent Oil Forecast
- PI PREDICTION. PI cryptocurrency
- ⚡Chekhov Spills The Tea-Will ADA’s $1.50 Dream Get a Chekhovian Plot Twist?😂
- SKY PREDICTION. SKY cryptocurrency
- GBP JPY PREDICTION
- Is Ethereum’s Price Rally Just a Mirage? 🤔💰
- Markets on Edge: Powell’s Speech May Turn Crypto Crazy or Calm Them Down
2025-12-15 20:15