Bitcoin, that digital enigma, continued its descent today, scraping fresh intraday lows near $105,500 as if it were auditioning for a Greek tragedy. As expected, its entourage of altcoins-Ethereum, Solana, and XRP-played their parts dutifully, shedding modest amounts of their value like a group of actors who forgot their lines. Yet, beneath this theatrical panic, traders cling to their Bitcoin like a child to a security blanket, their conviction unshaken. The question now is whether this dip is the prelude to a grand correction or merely the intermission before a spectacular comeback. 🎭
Exchange Outflows: The Bullish Whisperer
Exchange outflows, those cryptic indicators of investor sentiment, have been speaking volumes. A rising trend suggests indecision, while a declining one hints at optimism. Enter CryptoQuant, whose data reveals that the balance on exchanges has plummeted to 2018 levels. Nearly 209,000 BTC-worth over $14 billion-have been whisked away from centralized exchanges over the past six months. 🏃♂️💨
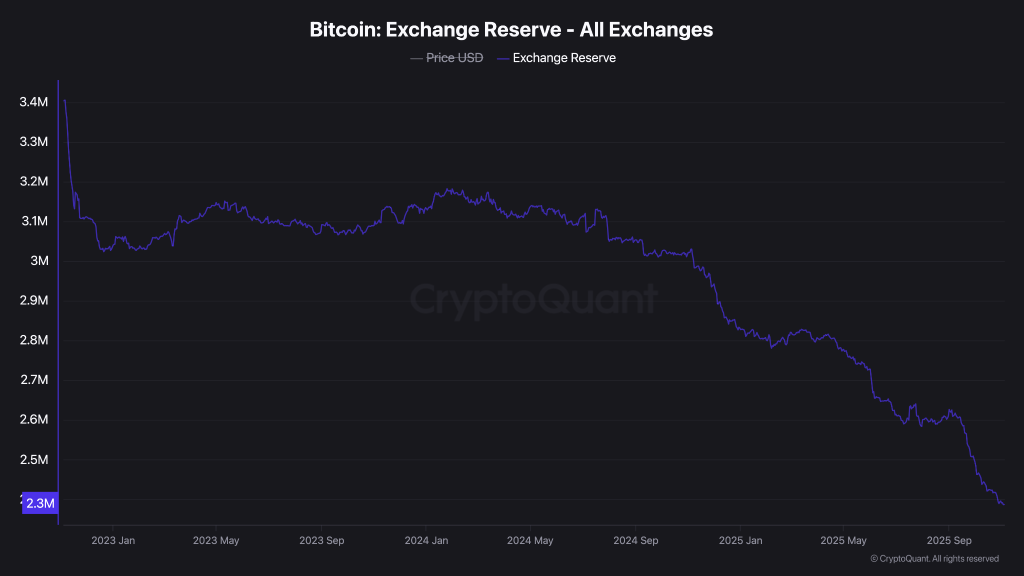
This steady exodus underscores growing confidence in self-custody and long-term accumulation. History shows that such withdrawals often herald bullish market phases, as fewer coins remain available for impulsive selling. If Bitcoin continues to hover near support, these outflows could indicate that the smart money is quietly stacking its chips, preparing for a grand performance once sentiment improves. Of course, if prices remain limp despite dwindling exchange balances, it might just be a sign of weak demand-or the macroeconomic gods playing hard to get. 🙃
BTC Price Analysis: The Levels That Matter
Bitcoin’s recent dip below $106,000 caused mild panic among short-term traders, who hastily rearranged their portfolios like chefs scrambling in a kitchen fire. However, the broader trend suggests a controlled pullback rather than a catastrophic collapse. The price lingers near the $105,500-$106,000 support zone, a region historically known for its magnetic pull on buyers. A rebound above $108,200 could reignite bullish momentum, paving the way toward $111,000. But if current levels crumble, BTC might tumble toward $102,500. For now, consolidation reigns supreme as traders ponder their next move. 🤔
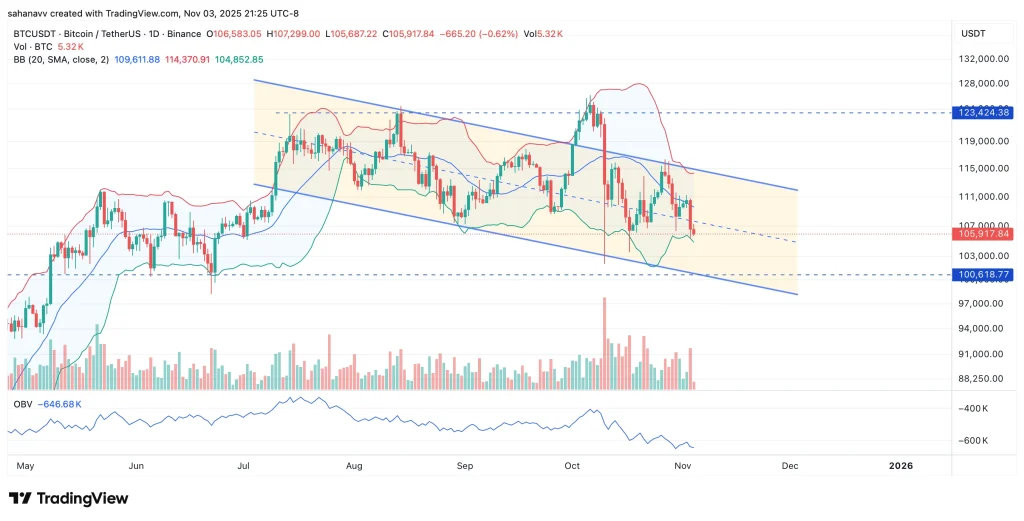
The Bitcoin price chart paints a picture of a descending parallel channel, signaling a sustained downtrend since July. After being rejected near the channel’s midline, the price nosedived to an intraday low of $105,500, testing the lower boundary. The Bollinger Bands are narrowing, hinting at a period of declining volatility that often precedes a breakout. Meanwhile, the On-Balance Volume (OBV) continues its descent, reflecting weakening buying pressure. A rebound above $108,200 could propel BTC toward $111,000-$114,000, while a breakdown below $105,000 might extend losses toward $100,600. 🎨
Final Thoughts: Will Bitcoin Hold the $100K Line?
Bitcoin’s precarious position near the lower boundary of its descending channel has sparked debates about whether the $100K mark can hold its ground. The declining OBV suggests dwindling buyer momentum, while narrowing Bollinger Bands tease a decisive move on the horizon. If bulls fail to defend the current range, a drop toward $100,600 becomes a plausible short-term scenario. However, consistent exchange outflows and long-term holding trends suggest any breakdown might be fleeting, setting the stage for a potential rebound once sentiment stabilizes. 🎬
Read More
- USD CNY PREDICTION
- Gold Rate Forecast
- Silver Rate Forecast
- Norway’s Wealth Fund Meets Bitcoin: A Most Surprising Union 💸
- BNB Chain vs Ethereum: 2025’s EVM Showdown Ends With a Snore 🤯
- Russia’s Crypto Shake-Up: Investors Watch the Market
- Ripple’s $1B Gamble: XRP’s New Empire or a Crypto Catastrophe? 🚀💸
- GBP RUB PREDICTION
- Notcoin’s Descent: When Bears Play Chess and Bulls Checkmate Themselves 🐻🐻🐻
- LTC PREDICTION. LTC cryptocurrency
2025-11-04 08:38