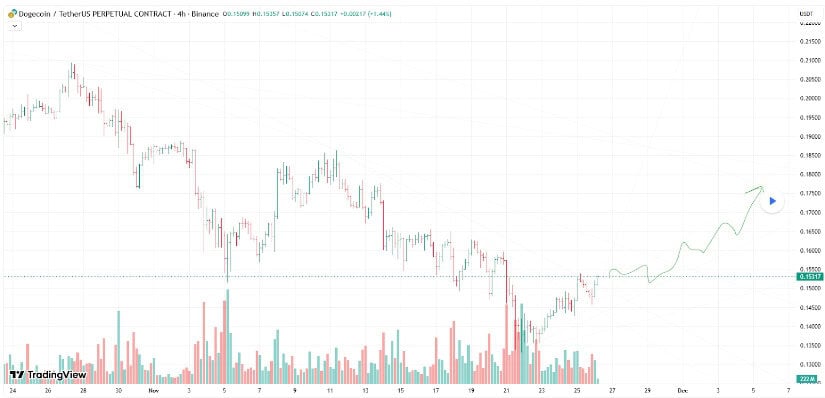
Well, here we are again. Dogecoin (DOGE) is trying to find its footing after a prolonged pullback. As of November 26, 2025, the price is hovering around $0.15, still a far cry from its wild 2021 peak. But don’t let that deter you, folks. Some analysts think we might be seeing the beginning of a base forming. Volatility seems to be compressing across the 4-hour, daily, and weekly charts, which, to the untrained eye, could mean something exciting is on the horizon. Or not. Time will tell. ⏳
Current Price Structure and Short-Term Outlook
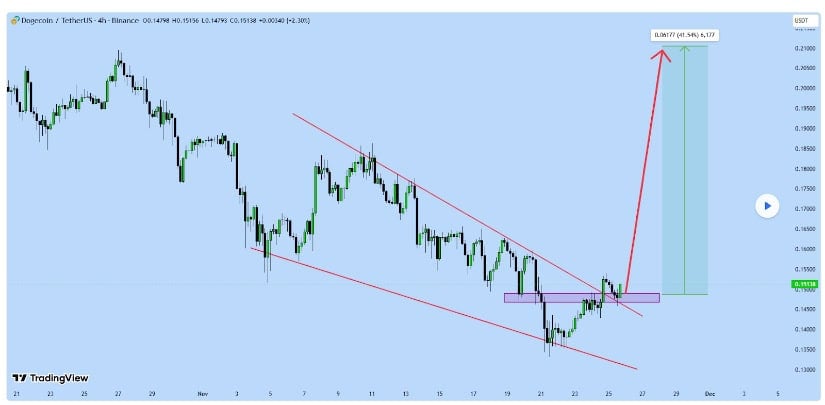
Now, let’s break this down. On the 4-hour chart, Dogecoin is trying its best to break free from a falling wedge-a pattern that, when confirmed, can signal bullish momentum. Will it break free, or will it just keep falling deeper into the abyss? Here are the technicals:
-
Price has moved above the wedge’s upper trendline with two consecutive closes. So far, so good!
-
Volume has increased by 12% compared to the previous 4-hour average. Let’s hope that wasn’t just a fluke.
-
RSI (Relative Strength Index) has bounced back from oversold territory, now sitting in a more neutral zone. Progress? Maybe.
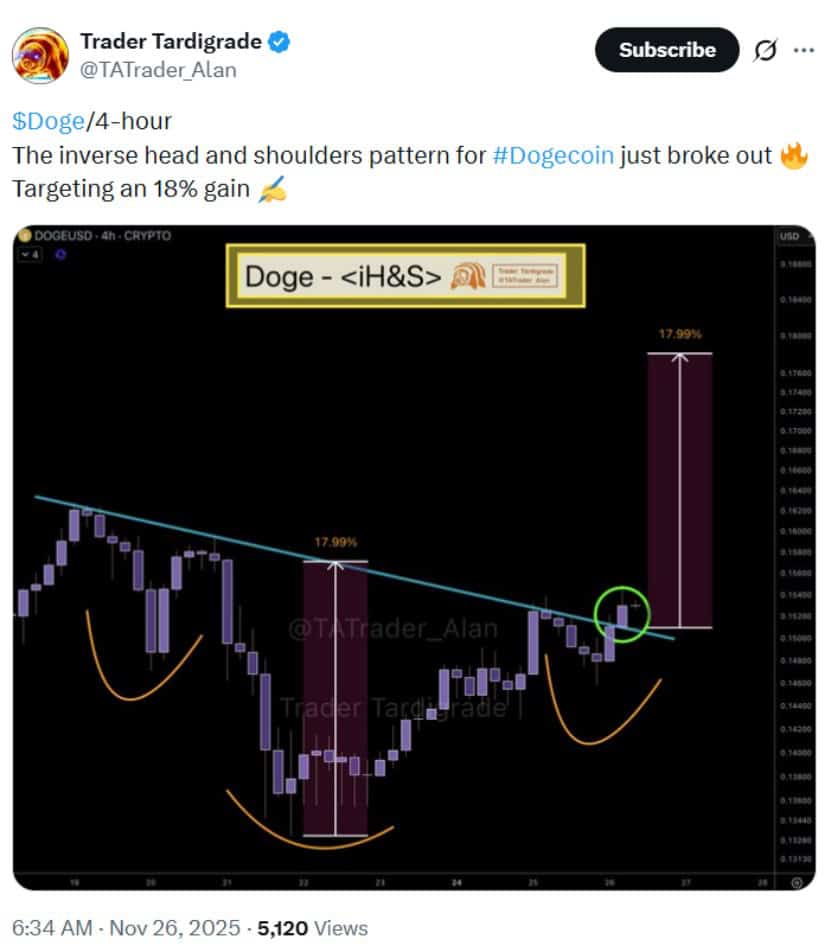
Market analyst Alan T. (who’s been doing this crypto analysis thing for over five years) has spotted an inverse head-and-shoulders pattern forming, which could push the price up to around $0.18-a neat 18% upside if it holds. Fingers crossed. 🤞
As for short-term resistance levels, we’ve got a few key areas to watch:
-
$0.160-$0.162: a bit of a price cluster, so tread carefully.
-
$0.173: the 38.2% Fibonacci retracement and a prior rejection zone. Oh joy!
-
$0.185: the top of the channel. Can DOGE reach it? Stay tuned.
But remember, these are just potential targets, not a guarantee of anything. If the price drops back inside the wedge, consider the bullish thesis null and void. 🚫
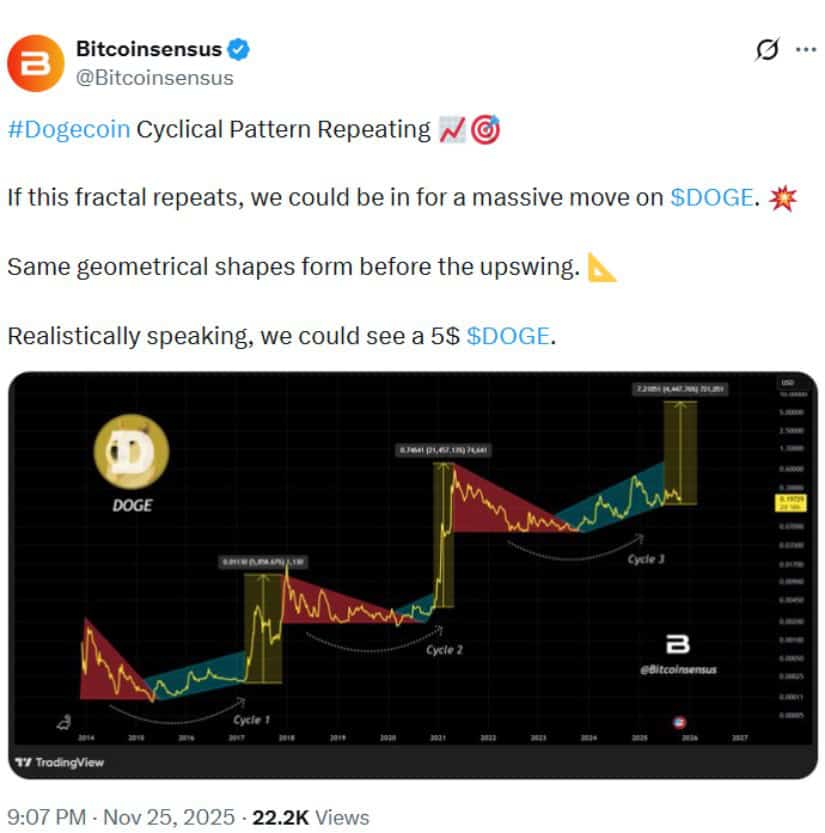
Historical Patterns and Mid-Term Expectations
Dogecoin is no stranger to a little history repeating itself. If we look at the weekly chart on a log scale (for those who like to get fancy), we see triangular consolidations followed by channel-based expansions, which have preceded some notable rallies in 2017, early 2021, and late 2023. But remember-just because it looks similar doesn’t mean it will be similar. Let’s not get ahead of ourselves.
Some analysts are drawing comparisons between the current structure and previous ones. But, as always, tread lightly-fractals are fun to look at, but they don’t guarantee anything.
Platforms like CoinCodex are projecting a potential price range of $0.39-$0.73 for late 2025 if the crypto market stays favorable. Sure, let’s just hope Elon Musk doesn’t tweet anything bizarre to derail this plan. 🚀
Key Price Drivers and Market Factors
So, what’s driving Dogecoin these days? A few things, actually:
-
Social Media & Influencers: DOGE is like a teenager-easily influenced by what’s trending on Twitter. A tweet from a celebrity can send it soaring, or crashing. 🙄
-
Market Sentiment: The Crypto Fear & Greed Index is sitting at a chilly 19 (Extreme Fear). Historically, this can sometimes signal early accumulation phases, but don’t bet your house on it.
-
Institutional Interest: Reports suggest that big players like Grayscale and 21Shares are exploring DOGE-related ETFs. If approved, that could bring some much-needed liquidity to the party.
-
Technical Indicators: DOGE is still trading below both its 50-day and 200-day moving averages, signaling a broader downtrend. But hey, consolidation near support levels often precedes trend transitions. Or it doesn’t. Who knows?
-
Tokenomics: The uncapped supply of Dogecoin, increasing by around 5 billion coins annually, keeps it from becoming scarce. So, if you’re hoping for Dogecoin to hit a crazy price like Bitcoin, it’s not looking too likely. Better start hoping for mass adoption. 🙃
Analyst Outlook and Risk Considerations
The short-term momentum is, let’s say, fragile. If the price stays above $0.133-$0.147, there might be hope for a rally. But if it dips below that? Well, don’t say we didn’t warn you. A sustained close above $0.16, and especially $0.20, would be needed to signal a stronger bullish reversal. Otherwise, we’re stuck in a never-ending cycle of hope and disappointment.
Forecasts for 2025 are all over the place:
-
Evidence-based models: $0.39-$0.73 (reasonable, if you believe in trends and volatility)
-
High-speculation scenarios: $1-$5 (because why not dream big? 😏)
It’s clear that risk management is a must. DOGE is highly volatile and prone to mood swings, much like your average social media influencer.
Final Thoughts
Dogecoin’s near-term technical structure suggests that there’s potential for upward movement-if the breakout holds and volume confirms it. But let’s not get too excited, folks. We’ve been here before, and we all know how this story goes. False breakouts are just around the corner. Keep your fingers crossed and your expectations in check. 🤷♂️
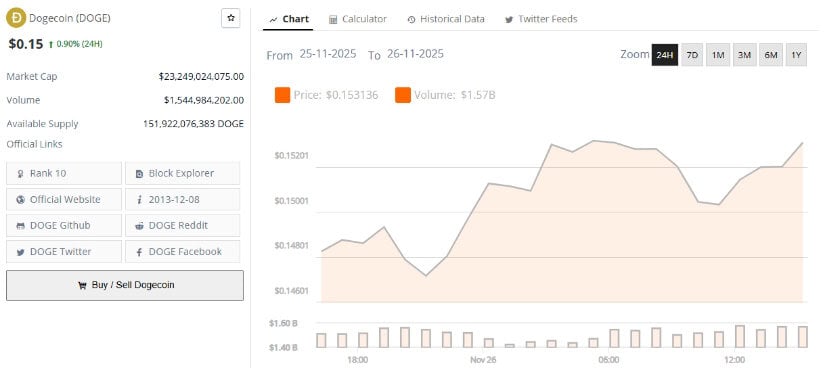
As of now, DOGE is trading at $0.15, with a market cap of around $23.1 billion and a circulating supply of over 151.9 billion coins. Will it go to the moon or flop back to Earth? Only time (and social media) will tell.
Remember, technical analysis gives us scenarios, not guarantees. Always combine it with some good old-fashioned risk management. You know, just in case. 😉
Read More
- Silver Rate Forecast
- Brent Oil Forecast
- Gold Rate Forecast
- Bitcoin’s $140K Dream: Miners’ Mysterious Shift!
- Chainlink’s $24 Comeback: Is FOMO About to Send It Soaring? 🚀
- ETFs Defy Market Plunge: Can Cryptocurrency Survive the Drama? 🤑📉
- USD CNY PREDICTION
- EUR CLP PREDICTION
- Senate’s Crypto Conundrum: Progress or Just a Fanciful Mirage?
- BTC PREDICTION. BTC cryptocurrency
2025-11-27 01:09