Ah, the much-awaited FOMC decision – an event that stirred the hearts of many, particularly those of the crypto and commodity lovers. Bitcoin, often hailed as digital gold, along with the old-school safe havens, gold and silver, now stand in a delicate dance of recovery after some serious turbulence.
The markets, finally recovering from the decision to cut interest rates by a quarter point, are now shifting their focus elsewhere – earnings, geopolitics, and everything in between. Forget the Fed – let’s talk about what really matters now!
What’s Next for Bitcoin, Gold, and Silver After the FOMC Interest Rate Slice?
As reported by BeInCrypto, the Fed’s rate cut of 25 basis points (bps), which ended its balance sheet reduction, aligns perfectly with the forecast of the great economists. This cut has provided a breath of fresh air for Bitcoin, Gold, and Silver, but don’t get too comfy – it’s far from a smooth ride.
While the rate cut itself is a bit of a bullish booster shot, Bitcoin’s true beauty might only be revealed after it hits $112,926. If it can close a daily candlestick above this magic number, breaking through the supply zone of $111,281 to $114,453, then-well, we might just see the bulls reign supreme over the bears. So dramatic, isn’t it?
And if Bitcoin continues to hold steady above its trusty ascending trendline, we might even witness this breach, which has been a longtime support level since April. But, hey, patience is key. Bullish traders should wait for confirmation and go long only if the price dances above $114,553. Based on volume profiles (yes, the fancy blue horizontal bars), there are plenty of bulls itching to play above this level. Keep your fingers crossed, folks!
According to the Sharpe Ratio, Bitcoin cycles between high and low-risk periods. Well, it looks like we’re about to shift into a much calmer, low-risk phase. But, of course, who knows?
– Ali (@ali_charts) October 30, 2025
There’s also the small matter of the $116,014 level – once support, now resistance, blocking Bitcoin’s path like a bouncer at a nightclub. A successful breach and retest could send BTC soaring to $120,574. But let’s be honest, the real magic happens when Bitcoin breaks and holds above $123,917 – the path to its all-time high above $126,199. An 11.33% rise? Dreams are made of this!
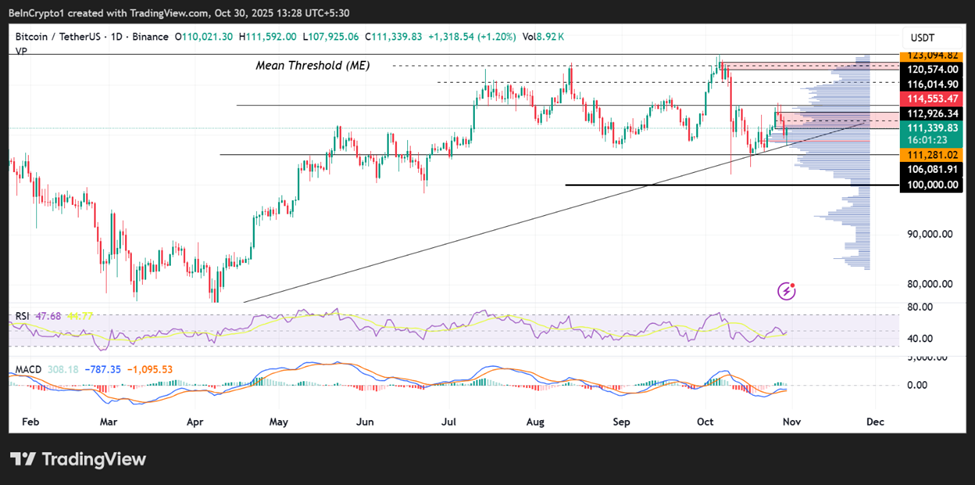
On the other hand, Ali the on-chain analyst warns that the TD sequential indicators are hinting at a potential Bitcoin sell-off. Should Bitcoin fall below its sacred trendline, we might witness a sell-off, potentially dragging it to support at $106,081. In the worst-case scenario, it could dip all the way to $102,000, as seen during the October 10 bottom.
But wait, the MACD (that trusty Moving Average Convergence Divergence) is in negative territory, signaling that sellers might just be in charge. And with the RSI below 50? Well, the drama continues!
Gold – Until It Breaks $4,048, Bears Are the Boss!
Gold, the old reliable, is trying to recover post-FOMC, with its RSI showing signs of life. But there’s a catch. There’s a whole lot of seller congestion hanging over its head.
The 9-day SMA (Simple Moving Average, for those keeping score) looms over gold at $3,975, acting like a no-entry sign for gold bulls. And don’t get us started on the bearish volume profiles (those yellow horizontal bars) – many sellers are just waiting for the gold price to reach between $4,002 and $4,086 to cash out.
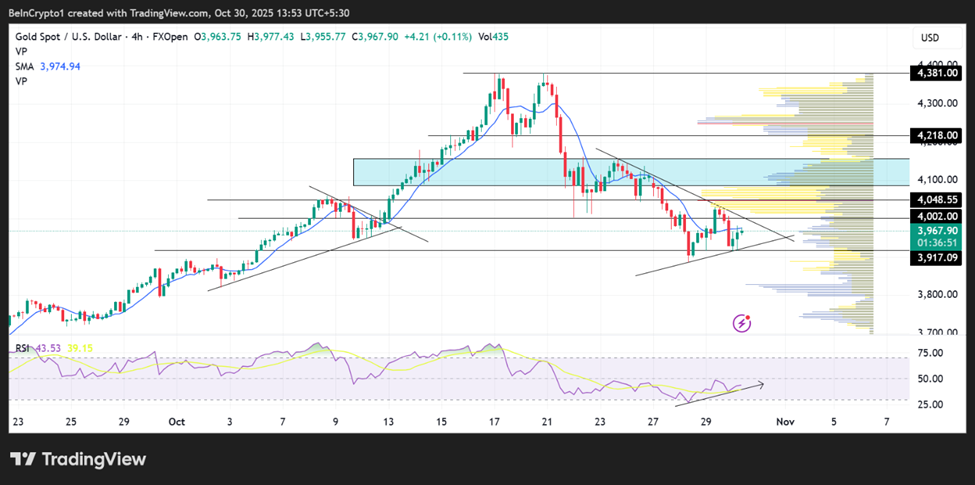
But hold your horses! There might be a breakout on the horizon as gold is filling up a symmetric triangle on the four-hour chart. Traders looking to go short might want to wait for a candlestick close below $3,917, with the potential to dip to $3,800. A neat little 5% drop, if you’re into that sort of thing.
Silver’s Got a Secret: $51.34 is in the Cards
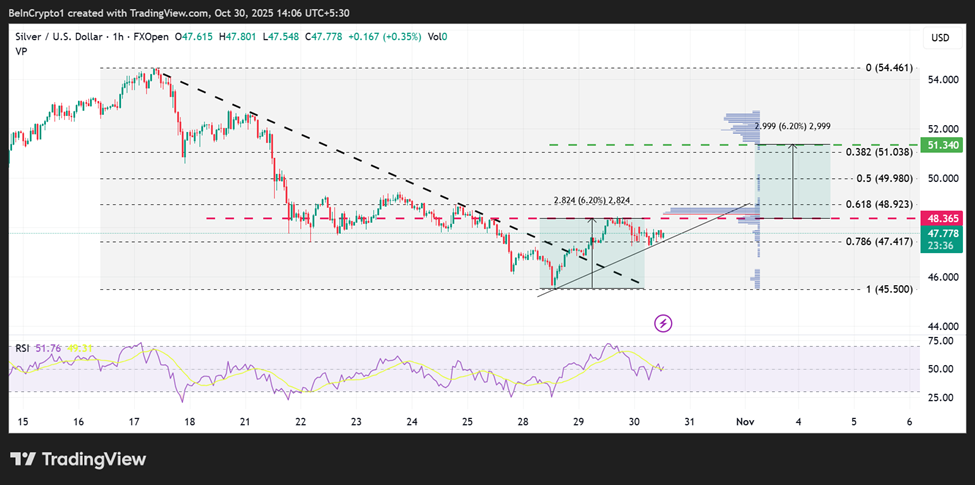
Silver, not wanting to miss out on the action, is also staging a mini-recovery. While it consolidates along an ascending trendline, the resistance at $48.36 remains a formidable wall.
The result? An ascending triangle – a classic bullish continuation pattern that could push silver prices up 6.20% to $51.34. The math is simple: measure the triangle’s height, then add it to the breakout point. Voila!
For those who like to play the volume game, bullish profiles (grey horizontal bars) indicate that there’s a strong crowd of buyers just waiting for silver to break above the $43.36 resistance level.
Key entry points for silver bulls? The magical levels are $48.92 and $49.98, marked by the 61.8% and 50% Fibonacci retracement levels. But tread carefully! If the silver price falls below $47.41, you might want to call it quits, as it could dip to $45.50, almost 5% below current levels. A risky business, indeed!
Read More
- Gold Rate Forecast
- USD CNY PREDICTION
- Silver Rate Forecast
- BNB Chain vs Ethereum: 2025’s EVM Showdown Ends With a Snore 🤯
- Norway’s Wealth Fund Meets Bitcoin: A Most Surprising Union 💸
- This Wormhole Tokenomics Thing Will Make You Rich-ish (Or At Least Smile)
- 🌴 Cayman Crypto Craze: DAOs Flock to Tax Haven Paradise! 🤑
- Ripple’s $1B Gamble: XRP’s New Empire or a Crypto Catastrophe? 🚀💸
- GBP RUB PREDICTION
- Brent Oil Forecast
2025-10-30 12:47