Ah, the mystical orange dot! A mere squiggle on a chart, yet it sends the crypto world into a tizzy like a wizard’s hat falling off in a crowded tavern. Could Michael Saylor’s latest post be the harbinger of another Bitcoin binge? Or is it just a man with a penchant for colorful charts and dramatic proclamations like “The Turn of the Century”? One can only wonder if he’s predicting the end of time or just the start of another shopping spree.
The Great Orange Dot: A Signal or a Squirrel Distraction?
On the first day of March, when the world was still recovering from too much pancake tossing, Strategy’s Executive Chairman Michael Saylor unleashed his infamous orange dot Bitcoin chart upon the masses via the social media platform X. Traders, ever the superstitious lot, took this as a sign that Strategy might soon announce another Bitcoin purchase, because nothing says “financial strategy” like reading tea leaves in a digital chart.
“The Turn of the Century,” Saylor proclaimed, as if he were unveiling the Eighth Wonder of the World rather than a graph with a few orange dots. The chart, a masterpiece of corporate art, plots each Bitcoin acquisition as a bright orange marker against the price performance over time. Past instances of this chart have been followed by formal filings of new buys, typically the next business morning, turning the orange dot into the crypto world’s equivalent of a Ouija board.
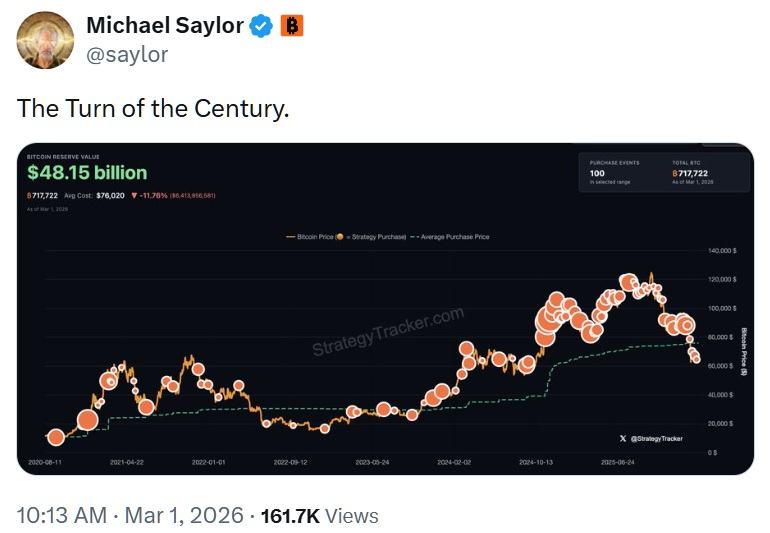
According to Strategy’s publicly displayed holdings dashboard on March 1, the company currently hoards 717,722 BTC, valued at a cool $48.09 billion, with Bitcoin priced near $67,010. Their average purchase price? A mere $56,020 per Bitcoin, totaling $26.4 billion across 100 shopping trips. Meanwhile, MSTR trades at $129.50, down $3.90 (2.92%), with a market cap of $43.27 billion and an enterprise value of $57.68 billion. Open interest tied to the stock is $35.18 billion, and volatility is through the roof-114% over 30 days and 79% over a year. It’s like a rollercoaster designed by a mad scientist.
Beyond their Bitcoin stash, Strategy boasts $2.25 billion in USD reserves, $904 million in annual dividends, $8.25 billion in debt, and $8.46 billion in preferred equity. Net leverage? A modest 12%. They’ve got 53.2 Bitcoin years of dividend coverage and 29.9 months of USD coverage. With these numbers and the reappearance of the orange dot, the market is abuzz like a hive of bees after too much mead. Will another acquisition be announced? Only Saylor’s crystal ball-er, chart-knows for sure.
FAQ 🧭
- Why does Michael Saylor’s orange dot chart matter to investors?
Because in the absence of actual magic, people will cling to anything that resembles a prophecy, even if it’s just a colorful graph. - How much Bitcoin does Strategy currently hold?
Enough to make even a dragon jealous: 717,722 Bitcoin, valued at roughly $48.09 billion. - What is Strategy’s average Bitcoin purchase price?
A bargain at $56,020 per Bitcoin, though whether it’s a wise investment remains to be seen. - What could another orange dot signal for the market?
Either a forthcoming regulatory filing confirming more Bitcoin accumulation, or Saylor’s just really fond of the color orange. You decide.
Read More
- USD COP PREDICTION
- Silver Rate Forecast
- SOL PREDICTION. SOL cryptocurrency
- SPX PREDICTION. SPX cryptocurrency
- USD CAD PREDICTION
- Brent Oil Forecast
- Gold Rate Forecast
- TIA PREDICTION. TIA cryptocurrency
- XRP ETF Crushes Solana – First Day Madness! 🎉🚀
- TON PREDICTION. TON cryptocurrency
2026-03-02 01:57